

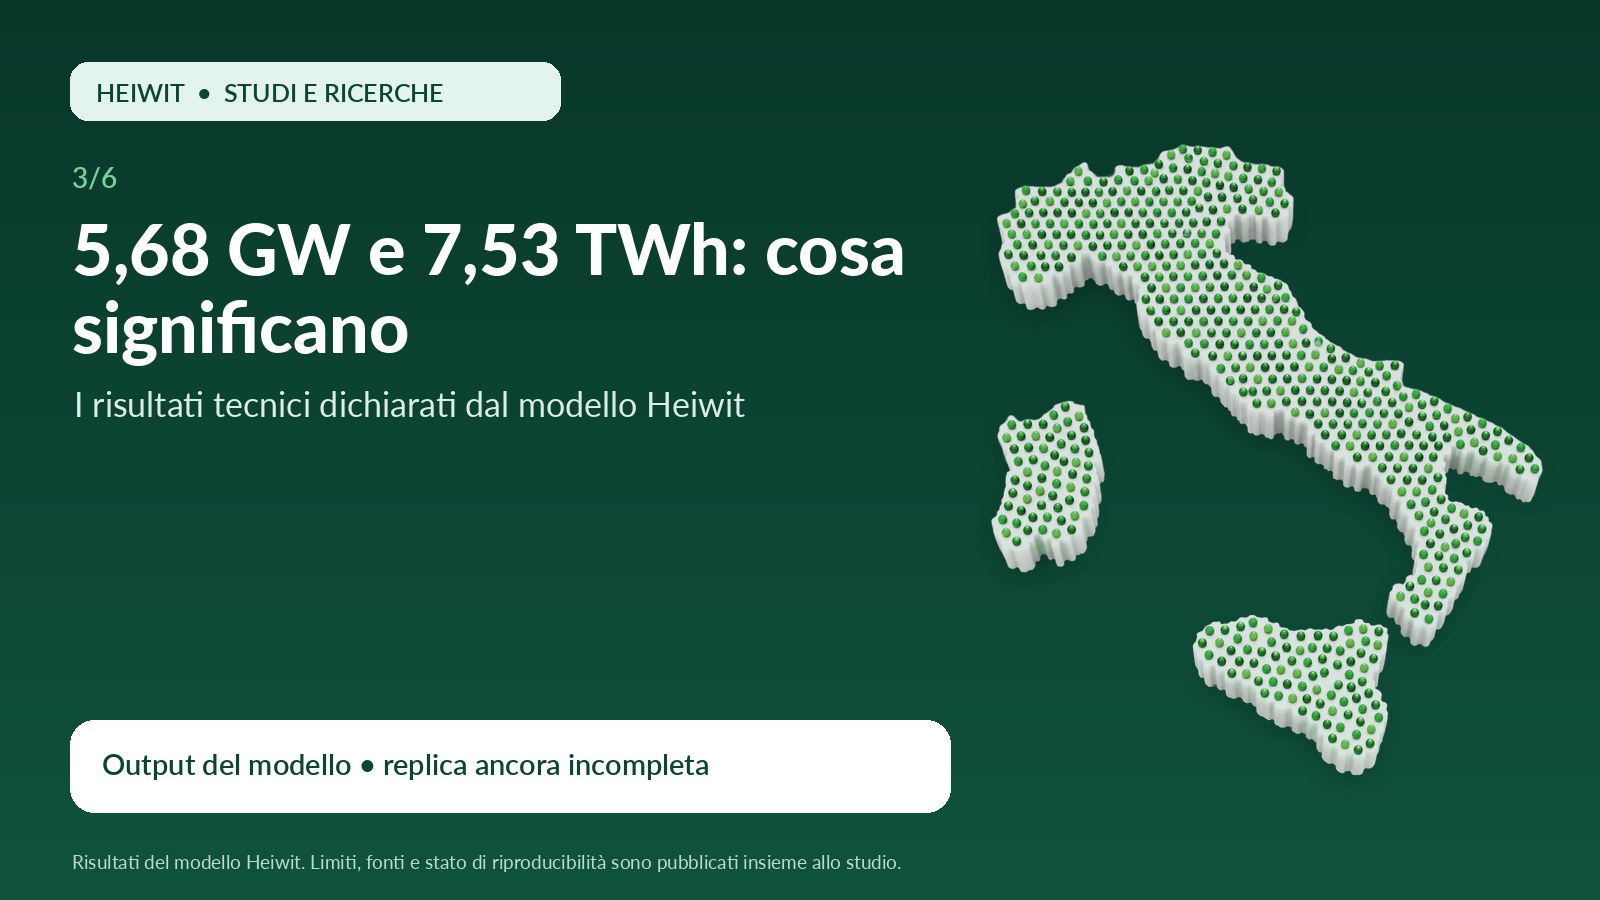
The Heiwit model yields 5.68 GWp of theoretical capacity and 7.53 TWh of annual production. These are large-scale results, but not yet independently replicated. This page presents them with correct equivalences and necessary caveats.
The chapter in 8 slides
Scroll through the original carousel created for this chapter. The images have been optimised for the web and uploaded to the WordPress Media Library.
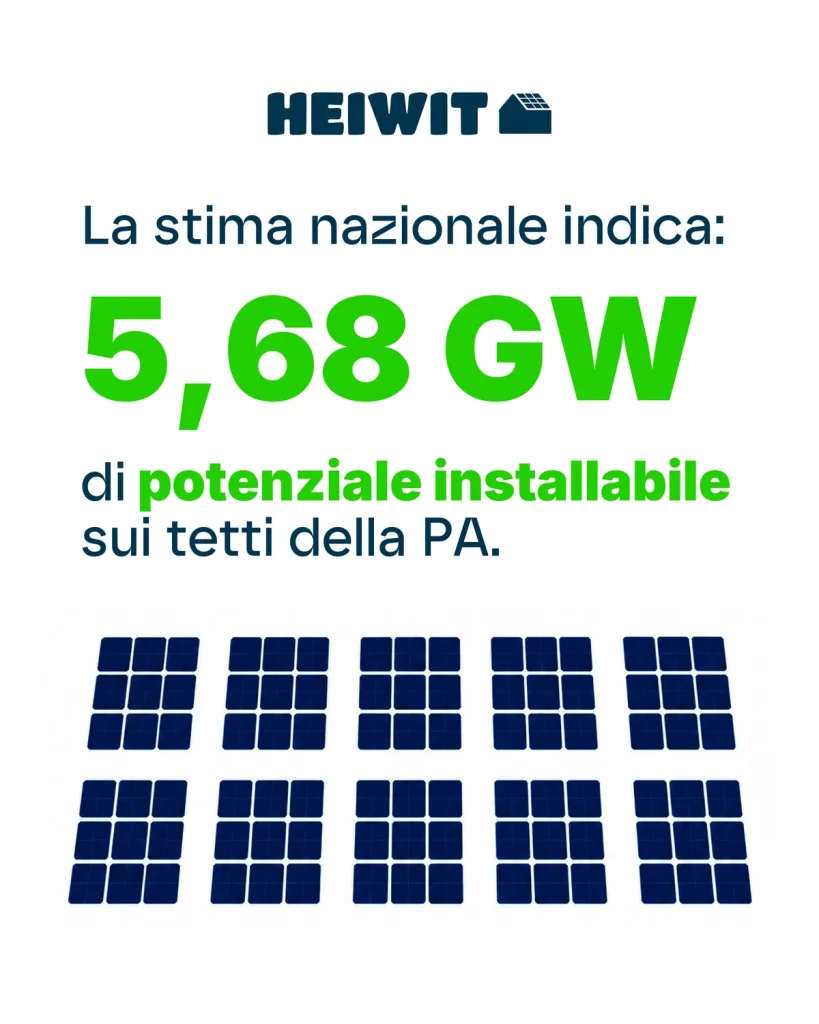
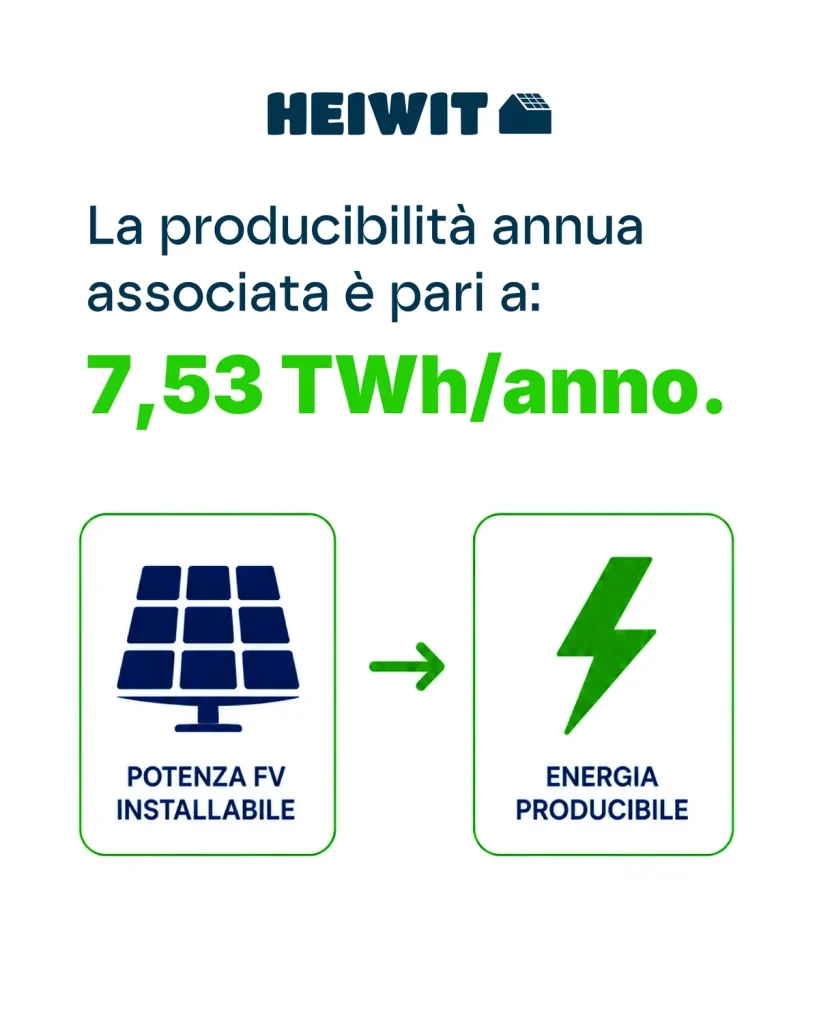
On your smartphone swipe sideways. From the keyboard use the left and right arrows.
The national figure
The model declares 5.68 GWp, with a sample range of 5.53–5.83 GW, and 7.53 TWh/year, with a range of 7.32–7.74 TWh. The audit could not regenerate these values. Furthermore, the ranges do not incorporate the main uncertainties of the frame and the APIs.
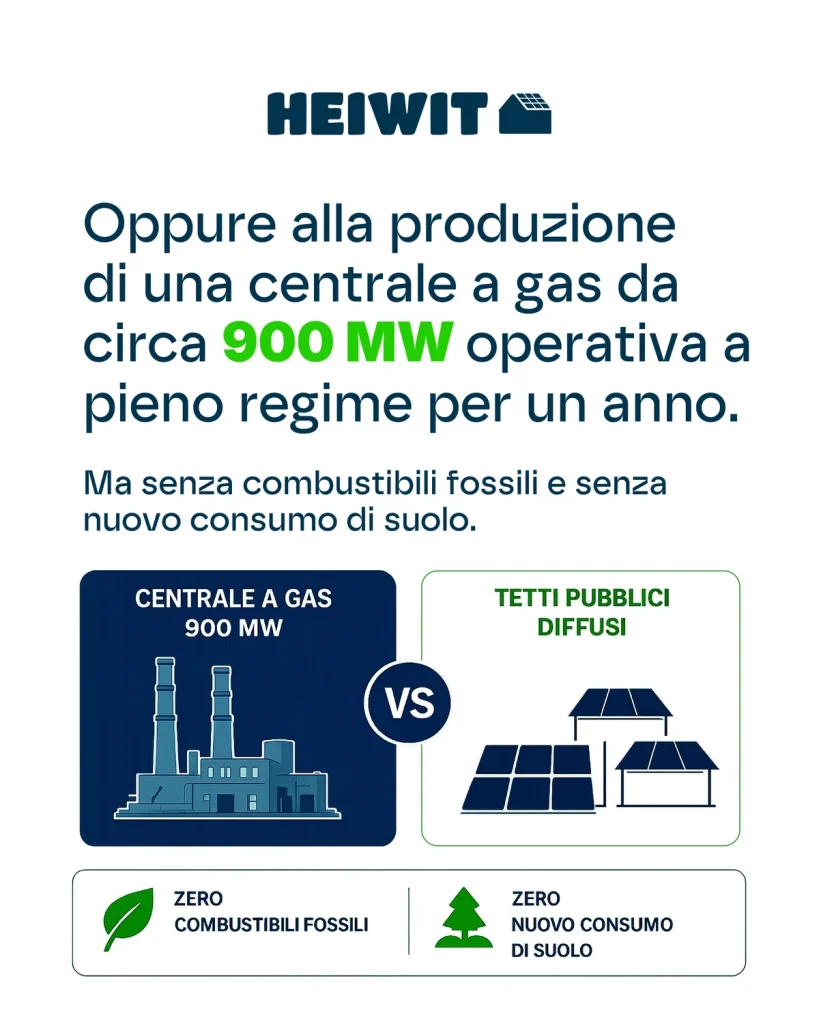
To put this into perspective, 7.53 TWh would correspond to 2.41% of Italy’s projected 2024 electricity demand of 312.285 TWh. Dividing this by 8,760 hours gives an average continuous output of approximately 860 MW. This is an energy equivalence, not the actual output profile of an intermittent photovoltaic source.
Distribution by macro-area
| Broad area | Declared power | Declared output | Energy allowance |
|---|---|---|---|
| North-West | 1.62 GW | 2.04 TWh | 27,1% |
| North-East | 1.47 GW | 1.84 TWh | 24,4% |
| Centre | 1.04 GW | 1.40 TWh | 18,6% |
| South | 0.97 GW | 1.37 TWh | 18,2% |
| Islands | 0.58 GW | 0.88 TWh | 11,7% |
The North-West and North-East together account for 54.4% of capacity and 51.5% of modelled generation. The difference is due to the higher specific generation potential of the Centre-South. The regional figures reported — for example, approximately 900 MW for Lombardy and 750 MW for Veneto — remain provisional until the regional dataset is published.
Functional distribution
| Type | Count in the frame | Declared power | Declared output |
|---|---|---|---|
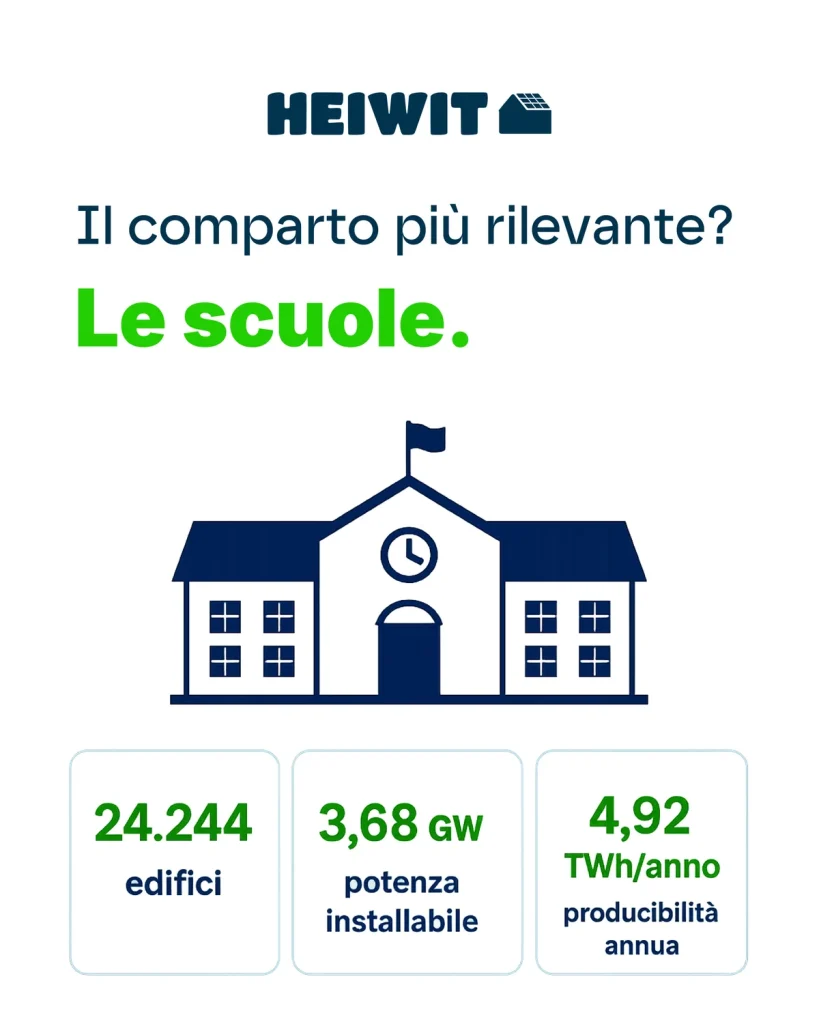
| Schools | 24.244 | 3.68 GW | 4.92 TWh |
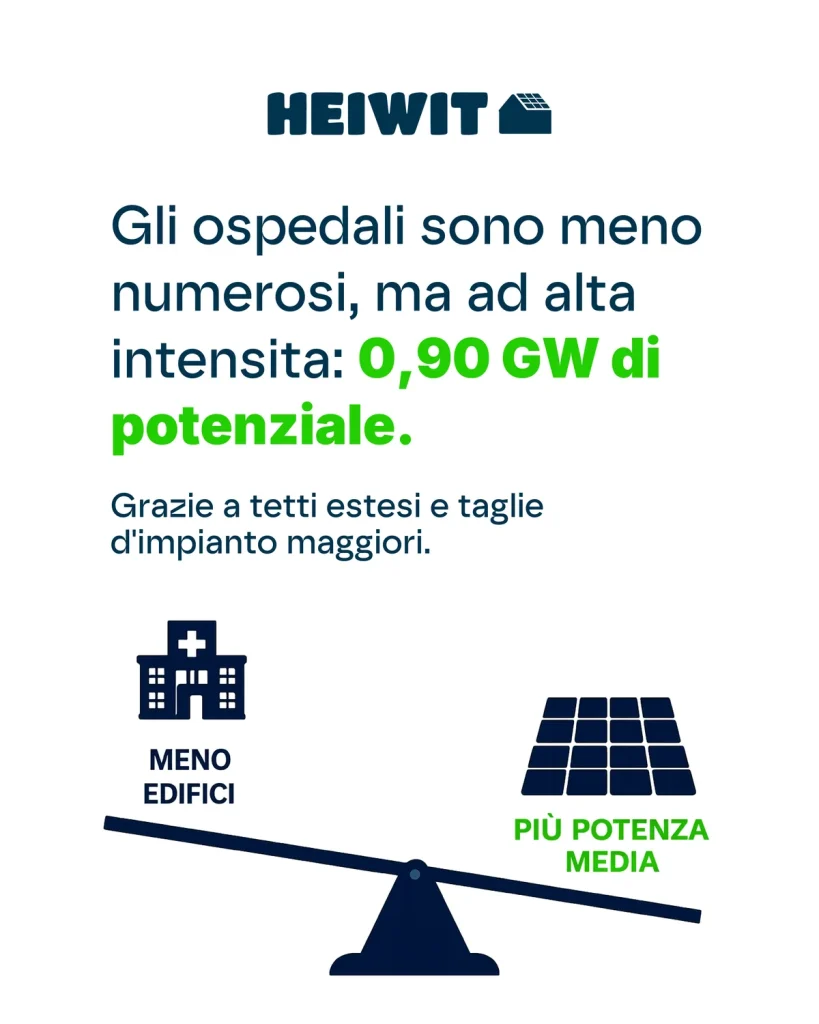
| Hospitals | 4.868 | 0.90 GW | 1.17 TWh |
| Other public administrations | 6.067 | 0.66 GW | 0.86 TWh |
| Municipality | 6.075 | 0.44 GW | 0.58 TWh |
Schools account for approximately 65% of the declared capacity, mainly due to their large numbers. Hospitals, on the other hand, stand out due to their potentially large average size and more consistent workloads. However, the description of the roofs as generally flat and largely unobstructed must be verified against the data and cannot be generalised to all buildings.
Equivalences to be used with caution
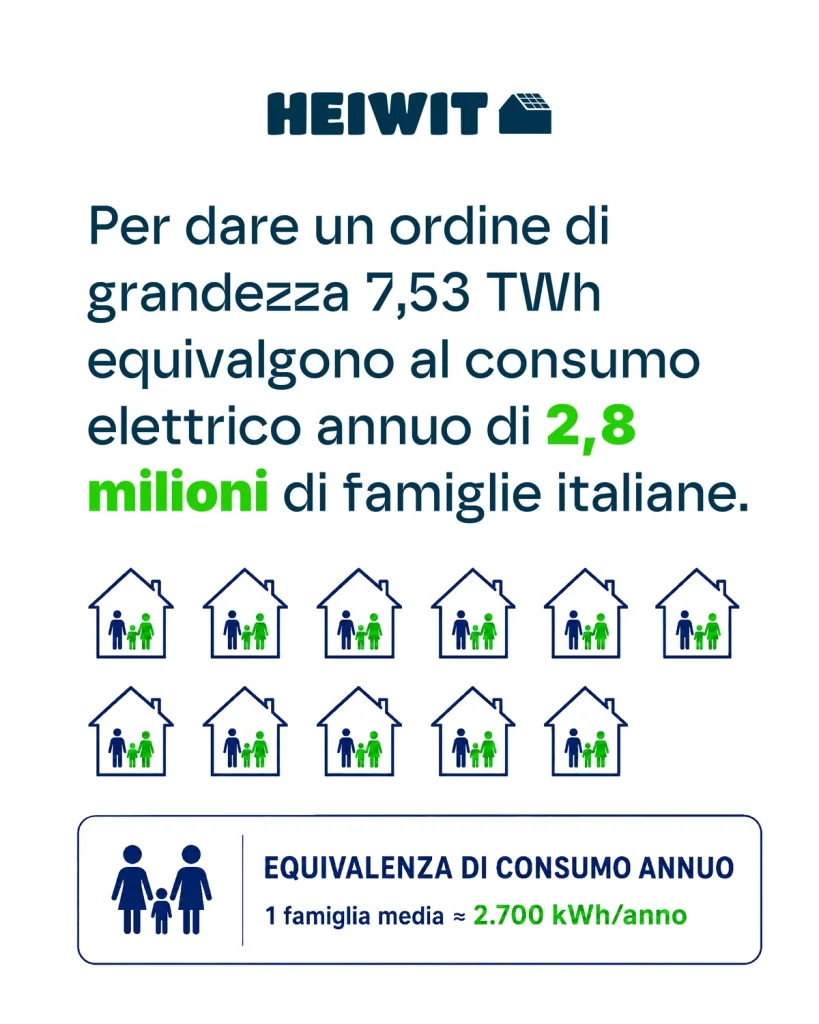
Assuming an annual household consumption of 2,700 kWh, 7.53 TWh is arithmetically equivalent to approximately 2.79 million households. The comparison is illustrative: it does not imply that the energy is available in the same places and at the same times as household consumption.
Why the result remains powerful even with the limitations
The value of the study does not depend on showing a figure without a margin of error. It depends on the ability to move from a national frame to a list of priority buildings, with solar data, load profiles, constraints and feasibility. Replication will make the data stronger, not weaker.
 Italian
  English
  German
  French
  Spanish
  Polish
  Dutch
Dutch  Romanian
  Hungarian
  Czech
Czech  Swedish
  Portuguese
  Greek
Greek