

This page brings together the studies and research published by Heiwit: 6 pieces of work in 3 sections, from data measured across the installed base monitored by AI-Care to the study on the solar PV potential of public administration roofs, through to laboratory tests on sodium-ion cells. Each study publishes its method, limitations and sources alongside the results. Updated October 2026.
Data from the installed base
Studies built on the data that Heiwit inverters connected to AI-Care record every day: generation, consumption, battery charging and discharging, grid import. Measured figures, not estimates.
-
SoP, State of Panels: the health index for solar panelsIndex
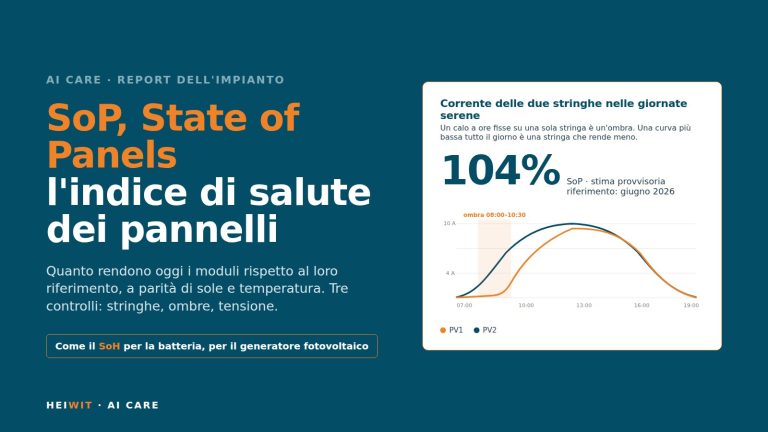
The index that AI-Care calculates for each system: how well the modules perform today compared with their reference, under the same sunlight and temperature, based on the inverter's string data. The method (filtering out periods when the inverter is limiting, yield normalised to irradiance, year-on-year comparison), the three checks on strings, shading and voltage, and the results on a sample of systems: 49% normal, 24% with a warning signal, 8% with an anomaly, 16% not yet assessable.
-
Heiwit systems: 92% of solar potential usedField data
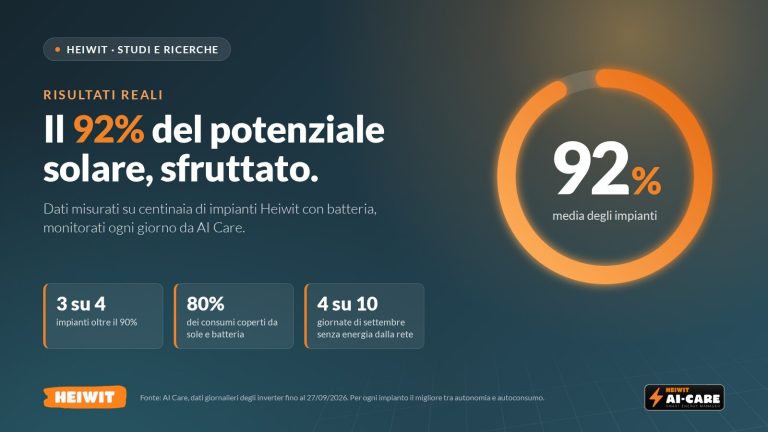
Systems with a Heiwit battery monitored by AI-Care use on average 92% of the solar energy available to them: three systems in four exceed 90%, almost one in two exceeds 95%. Data read from the inverter meters, day by day, up to 27 September 2026, with the full distribution and the calculation method.
-
High self-consumption with sodium-ion batteries: data from an Italian plant parkObservational study
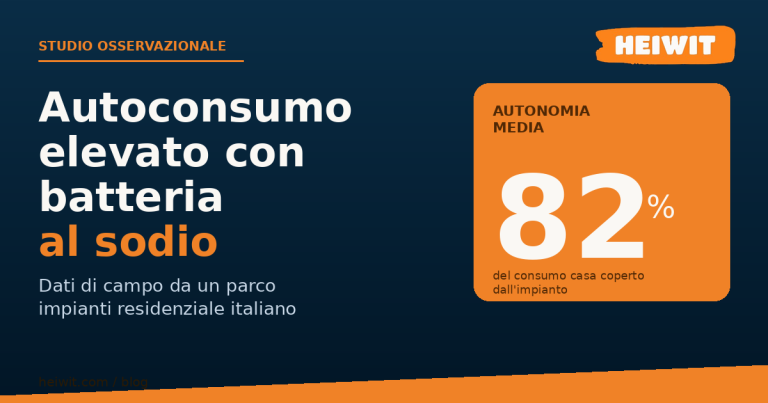
The distribution of energy autonomy across a sample of residential systems with sodium-ion battery storage: an average of 82% over a 60-day window, a median above 80%, and an observed range from 23% to 98%. The September 2026 study, with data up to 27 September, measures an average autonomy of 80%. Methodology, exclusion criteria, the role of the flat discharge curve and power behaviour in the colder months.
Scenarios and potential
Models that estimate how much solar PV could be installed and with what effects. The results are published together with the uncertainties and the points still open.
-
The photovoltaic potential of Italian public administration roofsStudy
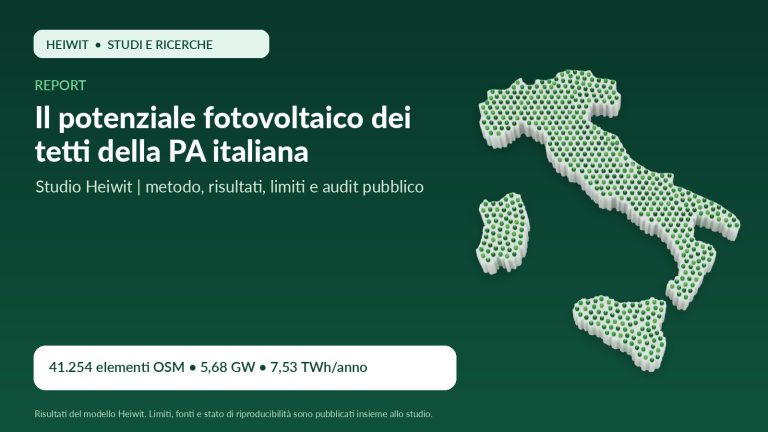
A bottom-up model of 41,254 buildings attributable to the public administration, with a stated sample of 10,000 units, Google Solar API, PVGIS and comparison with GSE Atlaimpianti: 5.68 GW of theoretical capacity and 7.53 TWh per year stated, €6.8 billion of CAPEX. Published with the limitations identified by the documentary audit, the inconsistencies still to be reconciled and the source attributions.
The series of in-depth articles
- How much public roofs can contribute to the PNIEC 2030
- How we estimated the potential of 41,254 buildings
- 5.68 GW and 7.53 TWh on public administration roofs: results and significance
- How much it costs to put solar on public roofs: CAPEX, LCOE and economic variables
- Can the public administration become self-sufficient? Energy, self-consumption and emissions
- From potential to operational plan
The full study in PDF (transparency draft, document under review)
Laboratory tests on cells
The results of the qualification tests on Heiwit's second-generation NFPP polyanionic cells, with the protocols in full: conditions, acceptance criteria and comparison with a reference LFP lithium cell.
-
Sodium-ion cell safety: what the evidence really saysTests
Nail penetration, overcharge, crush, oven and thermal control at 300 °C: the safety tests passed by NFPP polyanionic cells, described with the conditions of each protocol rather than with an adjective.
-
NFPP cells in the cold: 95% capacity at −20 °C in qualification testsTests
Low-temperature qualification data, with the comparison against a reference LFP cell, and an explanation of where the gap between the chemistries arises when battery storage is needed most, in the winter months.
How to read these studies
- Measured data, not estimates. The installed-base studies use the meters of Heiwit inverters connected to AI-Care; systems with insufficient data are excluded and their number is stated.
- Limitations published. Where a result cannot yet be fully reproduced, as in the public administration study after the documentary audit, the open points are written alongside the figures.
- Figures that change. Installed-base data are updated every day: each study states the date to which its values refer.
Frequently asked questions
Where do the data in the installed-base studies come from?
From Heiwit inverters connected to AI-Care, which send generation, consumption, battery and grid data every day. The studies use the values recorded by the inverter meters, not estimates: systems with insufficient data, for example those installed only a few days ago or with communication interruptions, are excluded and their number is stated.
Has the study on public administration roofs been verified?
The study underwent a documentary audit on 4 August 2026, which was unable to fully replicate the results because some detailed datasets and processing logs were missing from the material. For this reason, the values are published as results stated by the model, together with the inconsistencies still open, and the PDF is distributed as a transparency draft.
Can I quote the data from these studies?
Yes, citing Heiwit as the source and linking to the study page. For the study on public administration roofs, the attributions of the sources used by the model (OpenStreetMap, Google Solar API, PVGIS, GSE), listed at the end of the study, also apply.
How is this page updated?
Every time Heiwit publishes a new study. Installed-base figures change every day: each study states the date of its data, and any update to the values is flagged in the study itself.
Would you like to see your system's data?
The same indicators used in the studies, from SoP to self-consumption, are in the Report that AI-Care prepares for every Heiwit system. For questions about the studies, write to us via the page contact us.
 Italian
  English
  German
  French
  Spanish
  Polish
  Dutch
Dutch  Romanian
  Hungarian
  Czech
Czech  Swedish
  Portuguese
  Greek
Greek