

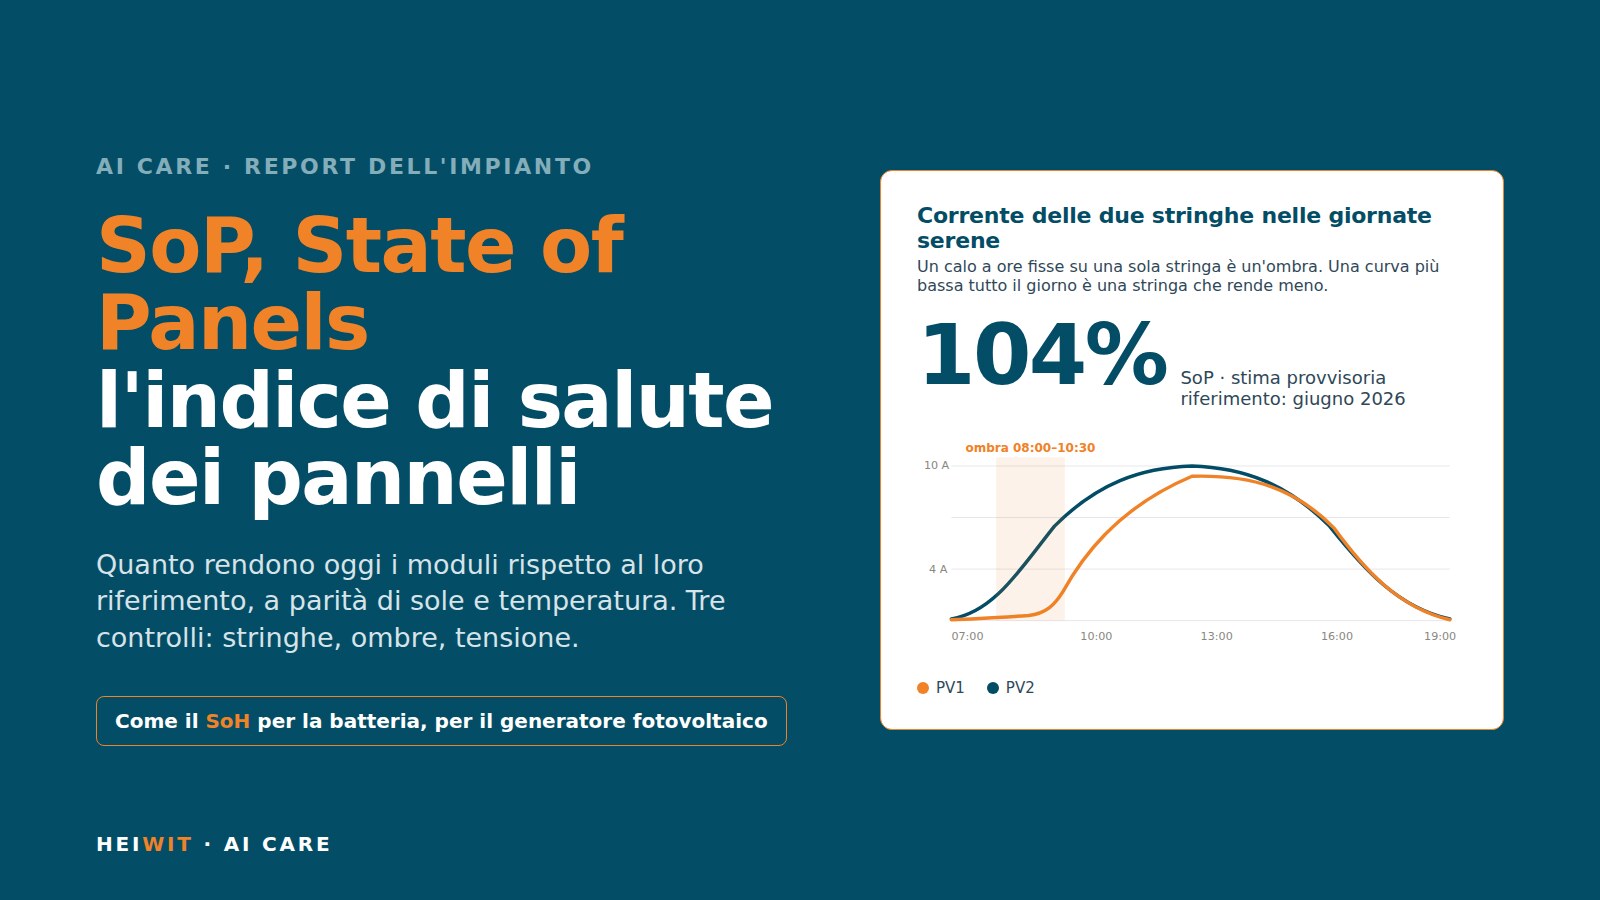
SoP (State of Panels) is the solar panel health index that AI-Care calculates for every Heiwit system. It tells you how well the modules perform today compared with their reference, under the same sun and temperature: 100% means the same as the reference, and the normal degradation of a silicon module is three to five tenths of a point per year. It is calculated solely from the data the inverter records every five minutes and from the irradiance at the site. It comes with three checks: the comparison between the two strings, the hours in shade and the operating voltage. You will find it in the System report, under “Panel health check”.
For the battery there has always been a figure everyone understands: SoH, State of Health, the remaining capacity compared with new. For panels there was nothing equivalent. A system can lose a quarter of a string’s output in four months, through dirt or a faulty module, and the electricity bill only shows it much later. From October 2026 AI-Care measures this too, and we have given it a name: SoP.
Why panels needed an index
Panels are the part of the system that nobody looks at. They have no BMS, they do not switch off and they raise no alarms. They lose output silently: dirt building up on one roof pitch, a growing tree, an oxidising connector, a cracking cell. The data to spot this already exists: the inverter measures the voltage, current and power of each string every five minutes. What was missing was a method for reading it.
The problem is not trivial, for two reasons. The first is that output depends on the sun: to say whether a panel is underperforming, you need to know how much sun it has received. The second is less well known and applies to every system with a battery: for much of the day the inverter curtails output, because the battery is full and the home is using little, or because the system is in zero-export mode. At those moments the measured power tells you nothing about the panels. Across the Heiwit fleet, curtailment affects between 25% and 85% of daytime samples.
What SoP measures
SoP is the ratio, as a percentage, between the current normalised yield of the PV array and its reference normalised yield. Normalised yield is the power the modules deliver per 1,000 W/m² of sun on their plane, corrected to a cell temperature of 25 °C. It is a figure that does not depend on the weather and depends little on the season.
The reference is the system itself: its first months of data, excluding the first seven days of commissioning, when strings are often connected in stages. There is no need to know the rated power, the number of modules, or the orientation or pitch of the roof. Each system is compared with itself.
SoP comes in two forms.
- Final, year on year: each day is compared with the same day of the previous year. Season, roof orientation and seasonal shading cancel out by design. This is the method the US laboratory NREL codified in the RdTools package for measuring module degradation. It requires a year of history: for the first Heiwit systems it arrives in December 2026.
- Provisional, in the first year: the yield of the last thirty days divided by the reference yield. The season is compensated only by the plane-of-array irradiance model, leaving a residual that we have measured across the fleet: around ±9%. For this reason the provisional value has wide thresholds and is always labelled as such.
How it is calculated
Inverter data
Virgo and Lybra inverters record the voltage, current and power of each of the two strings (PV1 and PV2) every five minutes. These are the same measurements AI-Care uses for the dashboard. SoP asks nothing new of the system.
Filtering out inverter curtailment
This is the decisive step. When the inverter curtails output, the string’s operating point rises towards the open-circuit voltage: the voltage exceeds the day’s maximum power voltage by more than 6% while the current falls below half of its maximum. Clouds do the opposite: the current falls, the voltage stays. The two conditions cannot be confused, which makes it possible to discard the moments when the measurement says nothing about the panels. Without this filter, every comparison between strings is distorted, because the inverter throttles the two maximum power point trackers unevenly.
Irradiance and temperature
To know how much sun the roof has received, AI-Care uses hourly meteorological reanalysis data from the Open-Meteo service (global, direct and diffuse irradiance, air temperature) for the system’s coordinates. Irradiance is transposed onto the plane of the modules with an isotropic model at a 25-degree tilt, on the plane that best describes the roof: south, south-east/south-west, east/west, east or west. AI-Care identifies the plane by itself, from the shape of the output curve on clear days. Cell temperature is estimated from air temperature and irradiance, and the yield is corrected to 25 °C using the typical coefficient for silicon.
The year-on-year comparison
For each day of the last twelve months, AI-Care takes the normalised yield of the same day a year earlier, with a tolerance of three days, and calculates the ratio. The final SoP is the median of these ratios; the range between the sixteenth and eighty-fourth percentiles shows how precise the measurement is. With a year of data, anomalies above 3-5% can be detected; the normal degradation rate, which is 0.3-0.5% per year, requires three or four years of comparisons. We say this clearly, because an index that promised more would not be honest.
The three checks that accompany the index
String balance
A string’s current is proportional to the sun it receives and almost insensitive to temperature. Between two strings on the same roof pitch, the ratio of their currents is a design constant: if it changes, something has happened. AI-Care compares the ratio for the last thirty days with the reference ratio and, using the normalised yield of each string, tells you which of the two has changed and in which direction. A string that performs more compared with the reference, because a seasonal shadow has passed, is not a fault and is not flagged as one. A string that has stopped while the other is working is flagged immediately.
Shading
When a shadow covers part of a string, the bypass diodes of the affected modules start conducting and the string voltage collapses, while the other string continues to operate at normal voltage. It is a unique signature: no other phenomenon lowers the voltage of just one string by more than a fifth while the other is normal. For every half-hour of clear days, AI-Care counts how often this signature appears and turns it into a sentence: “PV1 in shade from 8:00 to 10:30, around 2.5 hours a day”. It also tells you whether the hours in shade have increased compared with the first months, a sign of a growing obstruction.
String voltage
A string’s operating voltage depends on the number of modules in series and on temperature. The ratio between the voltages of the two strings cancels out temperature, because they are on the same roof. If the ratio changes, a module has dropped out of the series or a bypass diode has stayed in conduction: one module in nine is worth about 11% of the voltage, one sub-string about 4%. Here too AI-Care compares each string with its own reference voltage to tell you which one has changed, and distinguishes a voltage that has fallen (possible fault) from one that has risen (modified string or initial problem resolved).
What we have seen on a sample of systems
SoP has been calculated over the fleet’s entire history, from December 2025. On a sample of systems with sufficient data, 49% are normal, 24% have at least one warning sign, 8% have an anomaly and 16% cannot yet be assessed, because they are too recent or have only one string.
Some cases say more than the numbers. A control system in Sicily, with two identical strings and almost never curtailed, gives a current ratio of 1.000 over 125 days, no shading and a monthly yield stable within 5% from June to October: the method does not invent signals where there are none. A system in the Marche region shows one string that has lost a quarter of its yield since June while the other has remained stable, with no shading and normal voltage: a uniform loss of current, consistent with soiling or a mismatched module, which a technician will check. An east/west roof in Romagna shows shading from the ridge at the extreme hours of the day, a few tens of minutes on each roof pitch, and the east/west plane recognised by AI-Care keeps the monthly yield within 3%, where the south-facing plane would have been out by 21%.
Where to find it in AI-Care
The SoP is in the System report, in the “Panel health check” section, below the battery and environmental impact cards. The section shows the index with its status (final or provisional), the three checks with a clear status (OK, warning, anomaly, not assessable) and a sentence in Italian explaining what was seen and what it may mean. Below the shading check, an hourly strip highlights the half-hours in shade for each string.
The same section is part of the PDF report that the customer can print or save, with a chart of the current of the two strings hour by hour on clear days: a sharp drop at fixed times on one string only is shading; a lower curve throughout the day is a string that is underperforming.
Installers can also find it in the fleet of systems, Technical tab, in the “Panels” column: the index, the worst issue in a few words and a filter to show only systems with an anomaly. This way, cases with an anomaly can be found in one go, without opening one report at a time.
The data are updated every night. Each system's reference starts from its commissioning; the first final year-on-year values will arrive in December 2026 for the oldest systems.
The limitations, stated clearly
- The provisional value carries an uncertainty of around ±9%: between 90 and 110 it distinguishes nothing; below 80 it is significant.
- The normal rate of degradation cannot be measured with one year of data. With one year, anomalies can be seen, not half a point per year.
- Systems with a single string have only the index: the three checks need something to compare against.
- A system commissioned with a fault that was later fixed has an incorrect reference until its healthy history outweighs the faulty one. In that case, AI-Care says so.
- On systems curtailed for most of the day, there are few usable samples and the provisional value is less reliable. The number of usable days is shown in the section.
Methodological note and sources
The normalised yield follows the principle of the temperature-corrected performance ratio of the IEC 61724-1 standard, applied to instantaneous power rather than daily energy, because energy curtailed by the inverter cannot be measured. The year-on-year comparison follows the year-on-year method described by Jordan, Deline, Kurtz, Kimball and Anderson, “Robust PV Degradation Methodology and Application”, IEEE Journal of Photovoltaics, 2018, and implemented in the RdTools package of the National Renewable Energy Laboratory. Irradiance comes from the ERA5 reanalysis archive via Open-Meteo; transposition onto the module plane is isotropic (Liu-Jordan); cell temperature is estimated with a linear model and the power temperature coefficient is −0.4% per degree. The name SoP, State of Panels, was chosen by Heiwit: in battery literature the same acronym stands for State of Power, an internal value of management systems that AI-Care does not display. The full definition of the index, with thresholds and validation cases, is documented and maintained together with the AI-Care code.
Frequently asked questions
What is the SoP of a solar PV system?
It is the State of Panels, the panel health index: the percentage ratio between the modules' yield today and their reference yield, under the same sunlight and temperature. 100% means the same as the reference. It is the panel equivalent of the battery's SoH.
Is an irradiance sensor needed on the roof?
No. AI-Care uses the string voltage, current and power measurements that the inverter records every five minutes and hourly meteorological reanalysis data for the system's coordinates. No additional components.
Does the SoP measure panel degradation?
It measures yield relative to the reference. With one year of data, the year-on-year comparison detects anomalies above 3-5%. Normal degradation, of 0.3-0.5% per year, becomes measurable after three or four years of comparisons.
Why does my system show a provisional value?
Because it has less than a year of history. The provisional value compares the last thirty days with the first months of operation and carries a seasonal residual of around ±9%. The final, year-on-year value appears when the system reaches one year of data.
What happens if AI-Care flags a panel anomaly?
The alert appears in the Report with a sentence explaining what was seen, for example which string is underperforming and by how much, or at what times a string is in shade. No automatic action is triggered: it is a diagnosis for the customer and the installer, who can check on site.
Does the SoP also work on systems with a single string?
Yes for the index, which compares the yield of the whole array with its reference. The three balance, shading and voltage checks need two strings to compare, and for these systems they are shown as not assessable.
The SoP is a feature of AI-Care, the Heiwit Smart Energy Manager, available for all systems with Virgo and Lybra inverters. More guides, calculators and tutorials in the Heiwit guide collection.
Technical content drafted and subject to internal review by HEIWIT R&D, the function responsible for classifying cells and conducting tests on Heiwit storage systems.
 Italian
  English
  German
  French
  Spanish
  Polish
  Dutch
Dutch  Romanian
  Hungarian
  Czech
Czech  Swedish
  Portuguese
  Greek
Greek