

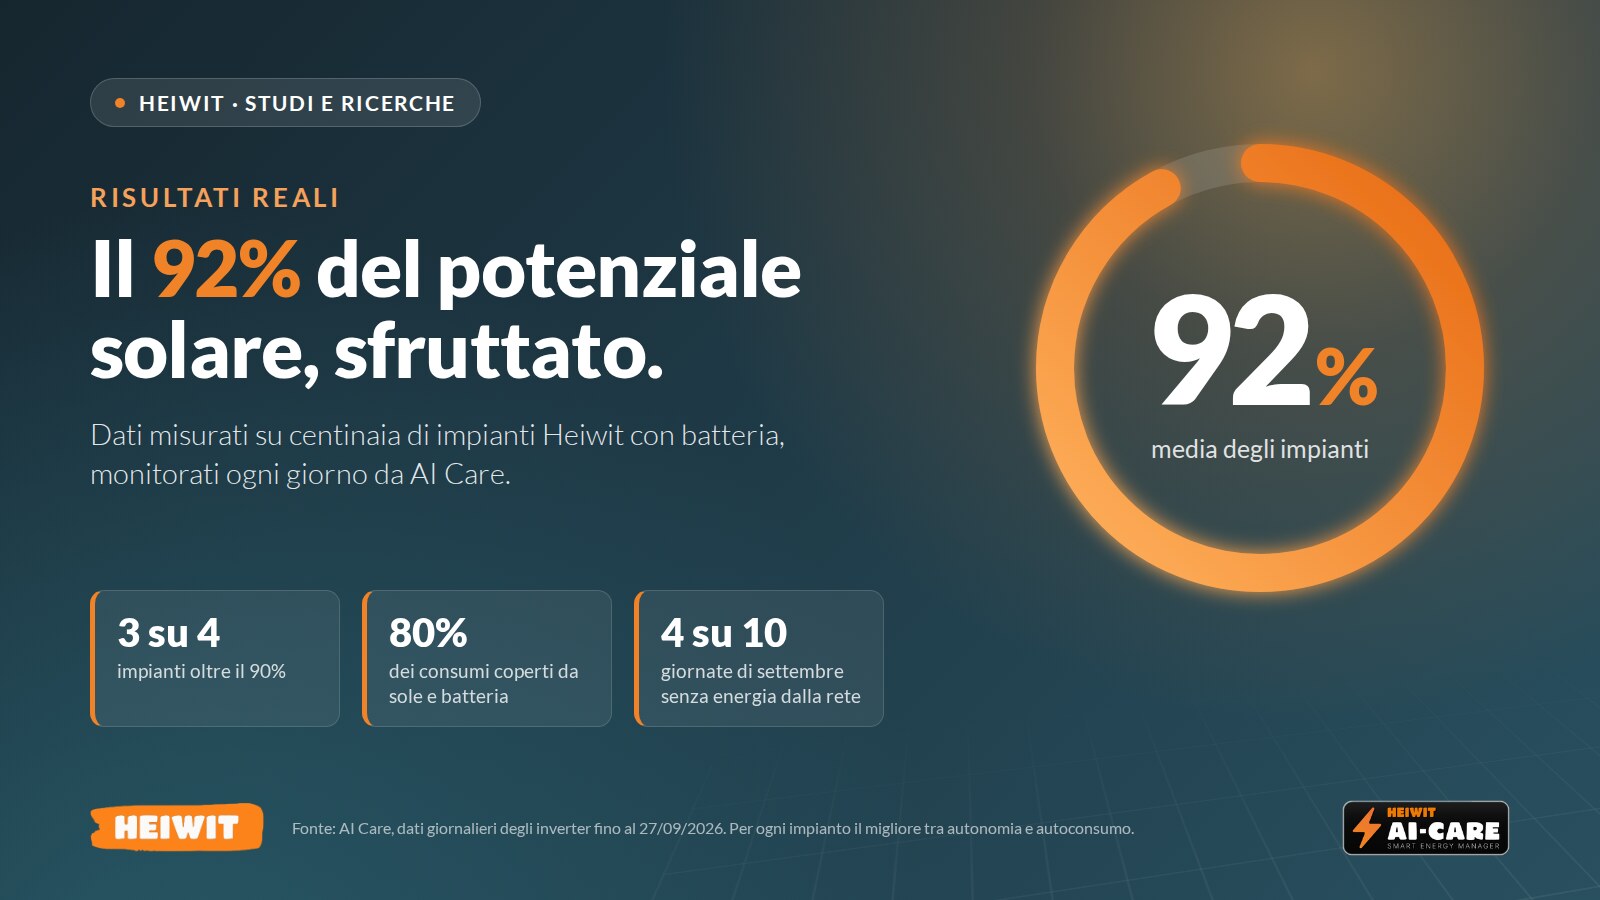
Heiwit systems: 92% of solar potential used. Real data from hundreds of systems
The solar PV systems with a Heiwit battery monitored by AI Care use, on average, 92% of the solar energy available to them. Three systems out of four exceed 90% and almost one in two exceeds 95%. These are measured figures, not estimates: they come from the inverter meters, day by day, up to 27 September 2026.
There are plenty of promises in solar PV. We prefer measured numbers.
Every Heiwit system connected to AI Care sends its data every day: how much energy the panels produce, how much the home consumes, how much passes through the battery, how much comes from the grid.
We analysed the data from hundreds of systems, day by day, to answer a simple question: how well do our systems really work?
Energy independence or self-consumption? It depends on the system
Two indicators are used to measure a solar PV system with battery storage.
- Autonomia: how much of the home's consumption is covered by the sun and the battery.
- Self-consumption: how much of the energy produced is used in the home.
Taken on their own, they only tell half the story.
Anyone who produces more than they consume will always have lower self-consumption: the energy they do not need inevitably goes to the grid. For them, the right figure is energy independence, i.e. how much of their energy comes from their own roof.
Anyone who consumes more than they produce will always have more limited energy independence: their roof is not enough to cover everything. For them, the right figure is self-consumption, i.e. how much of the energy produced they manage to use.
That is why, system by system, we take the better of the two. It is the indicator that shows how far the system makes use of the sun compared with the maximum possible, whatever the ratio between production and consumption.
A system cannot use more energy than it produces, nor more than the home consumes. The 92% measures how close our systems come to that limit.
The results: 92% on average
- 92%: the average value across the systems.
- 95%: the value of the typical system, the one exactly halfway down the ranking.
- 9 systems out of 10 exceed 80%.
- 3 systems out of 4 exceed 90%.
- Almost 1 system in 2 exceeds 95%.
Summer and winter: never below 91%
The result does not depend on the season.
In the summer months, with plenty of sun, the typical system covers more than 90% of the home's consumption. In the winter months, when the sun is lower, the systems use practically all the energy they produce.
| Mese | Media | Typical system | Systems above 90% |
|---|---|---|---|
| December 2025 | 98,8% | 99,0% | 100% |
| January 2026 | 97,0% | 98,1% | 90% |
| February 2026 | 94,7% | 97,3% | 83% |
| Marzo 2026 | 91,9% | 94,3% | 71% |
| Aprile 2026 | 93,2% | 95,8% | 79% |
| Maggio 2026 | 91,6% | 94,9% | 75% |
| Giugno 2026 | 92,7% | 95,0% | 72% |
| Luglio 2026 | 91,3% | 94,8% | 73% |
| Agosto 2026 | 93,6% | 96,6% | 82% |
| September 2026 | 94,4% | 97,5% | 81% |
Systems with at least 20 days of data in the month. September up to the 27th.
The battery: the day's sunshine, used in the evening
Where does the energy consumed in our customers' homes come from?
- 46% directly from the panels, at the moment it is produced;
- 35% from the battery: daytime energy stored and used in the evening and at night;
- insieme, l’80% of consumption is covered by the system.
The battery almost doubles the solar energy the home is able to use.
Without storage, much of the energy returned by the battery would have been exported to the grid during the day and bought back in the evening.
From the North to the islands
The systems are spread across Italy and the result holds everywhere. In every zone the typical system exceeds 92%:
- Nord: 95%
- Centre: 96%
- Centro-Sud: 95%
- Sud e isole: 92%
Days without buying energy
A settembre 4 days out of 10 ended without buying a single kWh from the grid: on those days the system covered all the home's consumption on its own, day and night.
Why we can publish these figures
AI Care is the Heiwit platform that follows every system day and night: production, consumption, battery, inverter.
It is thanks to this continuous monitoring that we can publish results measured system by system, rather than theoretical averages.
And it is the same monitoring that every customer finds in their own AI Care dashboard: the energy independence and self-consumption of their system, updated every day.
The sun isn't estimated. It's measured.
Frequently asked questions
What is the difference between energy independence and self-consumption?
Energy independence is the share of the home's consumption covered by the solar PV system and the battery. Self-consumption is the share of the energy produced that is used in the home instead of being exported to the grid.
Why do you take the better of the two for each system?
Because each of the two, on its own, penalises one type of system. Those who produce more than they consume necessarily export the surplus energy to the grid, so they have lower self-consumption even though they cover almost all of their consumption. Those who consume more than they produce have more limited energy independence even though they use almost all of the energy produced. The better of the two measures how close the system comes to the maximum possible.
Where does the data come from?
From the meters of Heiwit inverters, read every day by AI Care. The analysis covers hundreds of solar PV systems with a Heiwit battery, each with at least 30 days of data, up to 27 September 2026.
Methodological note: energy independence = 1 − grid import / consumption; self-consumption = (solar PV production − energy exported to the grid) / solar PV production; consumption = solar PV energy used directly + energy discharged from the battery + grid import. For each system, the higher of the two values, energy independence and self-consumption, is taken. "Average" is the simple average across the systems, "typical system" is the median. Electricity market zones derived from the location of the systems. Daily data from Heiwit inverters with a battery connected to AI Care, from autumn 2025 to 27 September 2026.
The heart of Heiwit systems is storage: the basic building block is the 10 kWh Heiwit sodium-ion battery, stackable up to three units per inverter.
 Italian
  English
  German
  French
  Spanish
  Polish
  Dutch
Dutch  Romanian
  Hungarian
  Czech
Czech  Swedish
  Portuguese
  Greek
Greek