


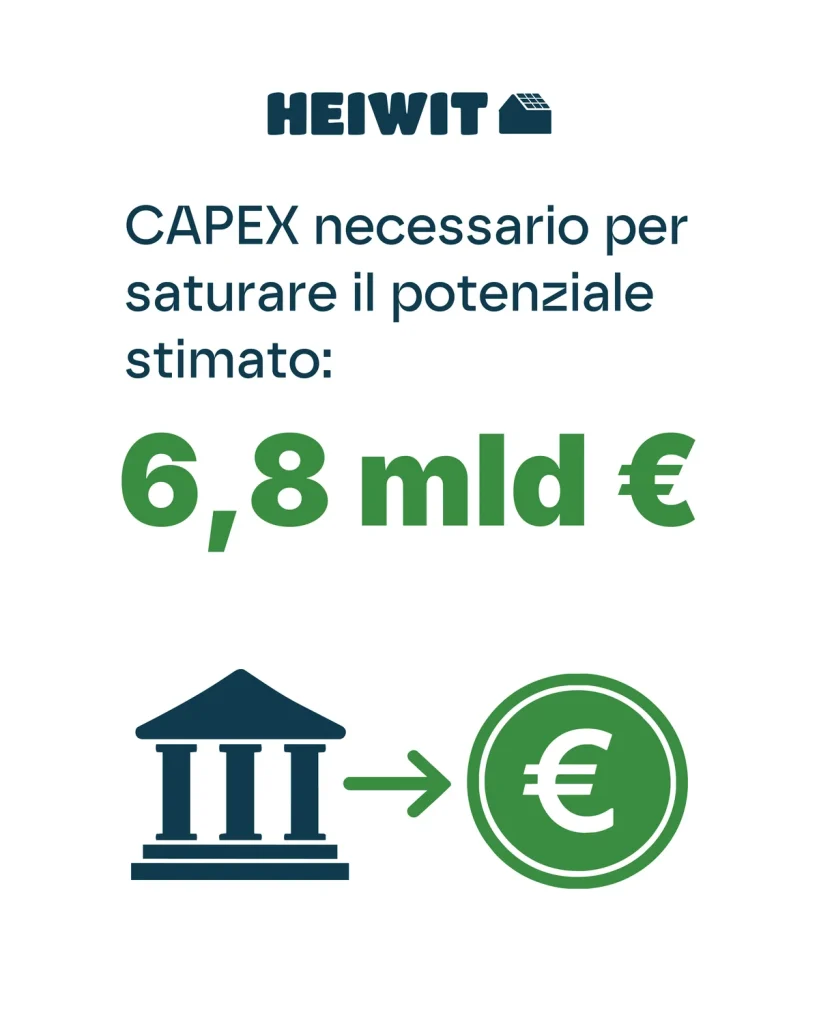
The preliminary economic model states an investment of approximately 6.8 billion euros. The figure is interesting, but it must not be turned into a promise of return until cash flows, price sources and sensitivity analyses are published.
The chapter in 8 slides
Scroll through the original carousel created for this chapter. The images have been optimised for the web and uploaded to the WordPress Media Library.



On your smartphone swipe sideways. From the keyboard use the left and right arrows.
The stated hypotheses
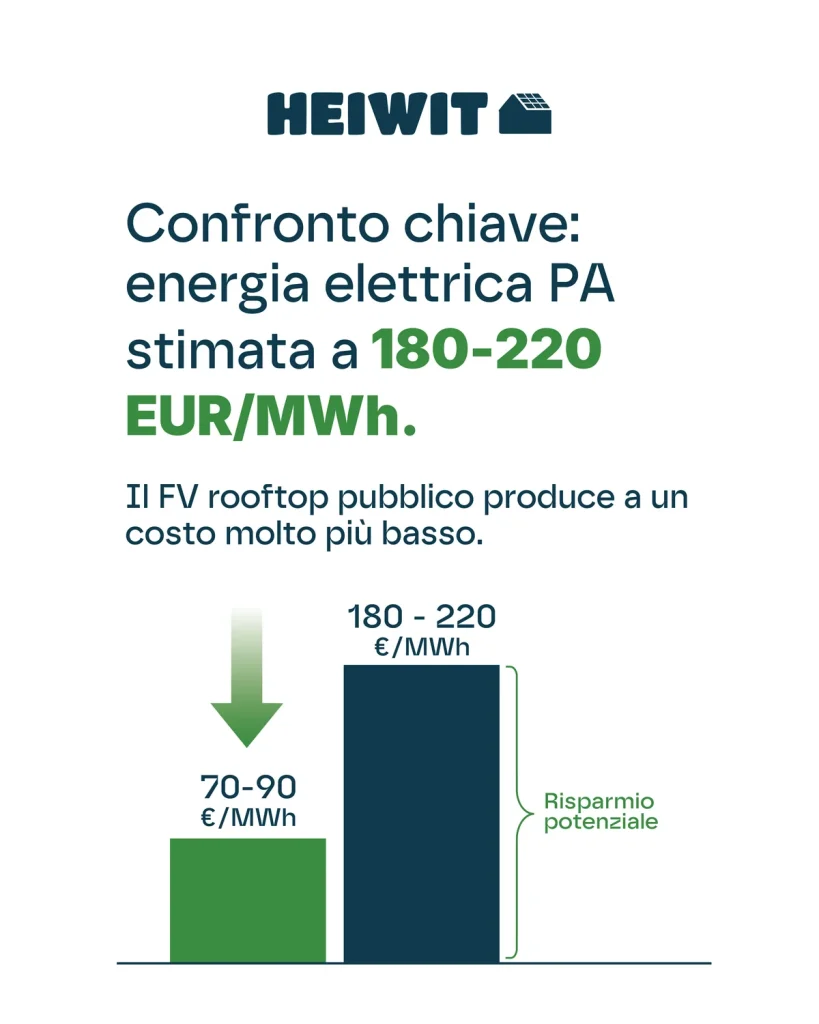
The preliminary model uses unit CAPEX ranging from 1,600 to 950 €/kWp depending on the size, annual OPEX equal to 1.2% of CAPEX, insurance at 0.3%, annual degradation at 0.5%, a WACC of 4%, self-consumption of 60%, a value of €180/MWh for self-consumed energy and €120/MWh for energy fed into the grid.
These are scenario assumptions, not guaranteed prices. They must be dated and linked to sources. Furthermore, the audited documentation does not cover VAT and taxation, connection costs, design costs, tenders, inverter replacement, downtime, curtailment and residual value.
Why size changes the economy
A large hospital can accommodate hundreds of kWp and benefit from economies of scale. A town hall with just a few tens of kWp incurs higher unit costs. Local energy yield also plays a part: for the same roof area, central and southern Italy can produce more energy per year. However, profitability does not depend solely on solar radiation: consumption patterns, the avoided cost, the capacity to feed electricity into the grid and operational continuity all play a part.
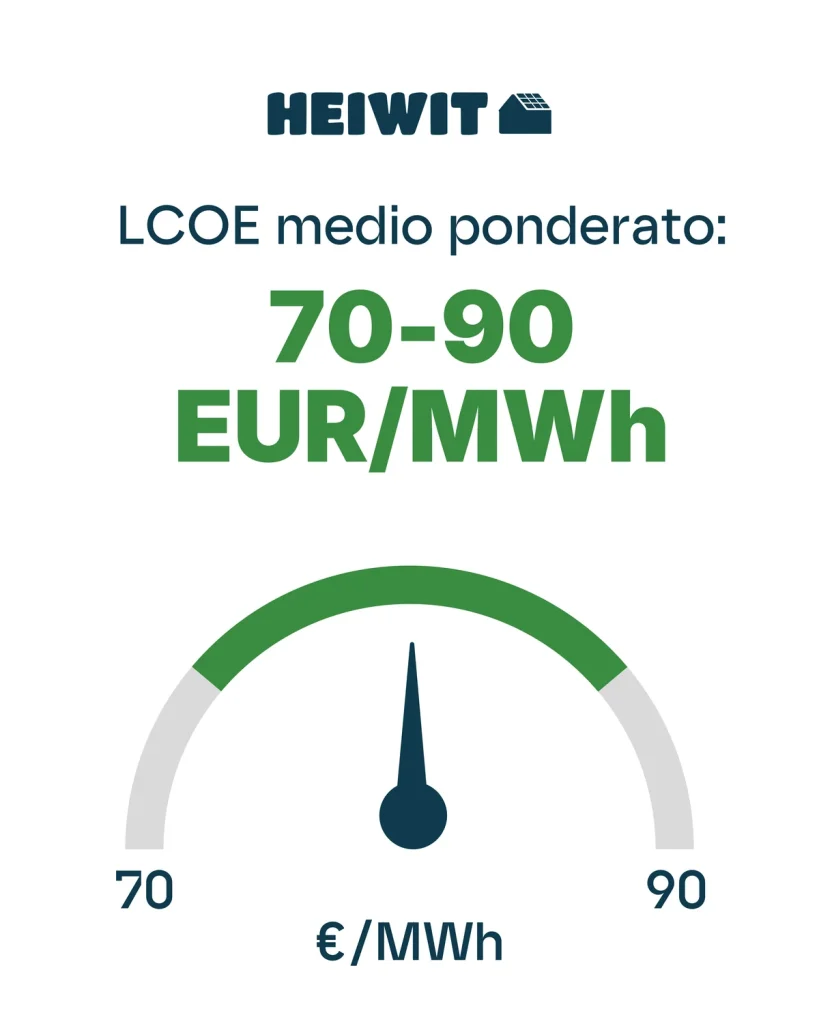
Why IRR, LCOE and payback periods have been suspended
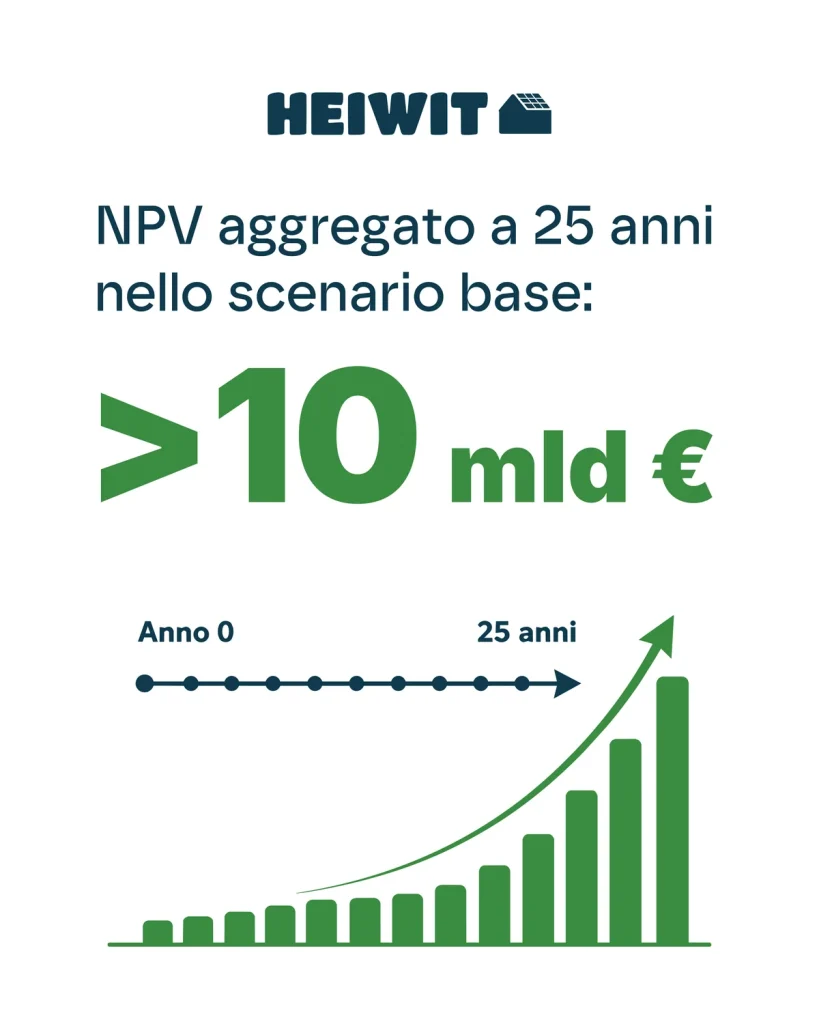
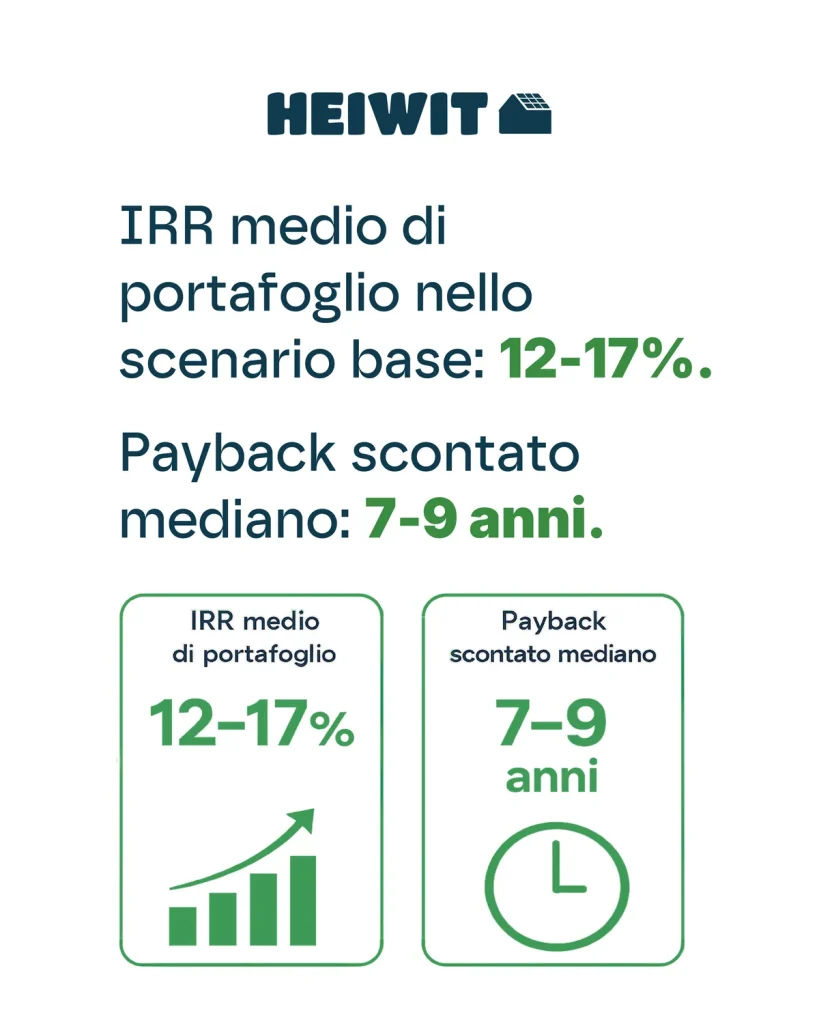
The original version included LCOE, IRR and payback periods for each cluster. The audit was unable to replicate these figures as the cash flow data was not available. Consequently, these values are not used as investment recommendations in the articles. The claim that «NPV is more than double the capital» has been removed: even assuming an NPV of 10 billion and CAPEX of 6.8 billion, the ratio is approximately 1.47, which is not greater than two.
The economic model to be published
- sources and date of each unit cost;
- annual cash flow by cluster and in aggregate;
- self-consumption share based on distinct hourly profiles;
- scenarios for energy prices and feed-in tariffs;
- sensitivity to CAPEX, WACC, degradation and inverter replacement;
- connection, design, tendering, insurance and maintenance costs;
- consistent treatment of tax, VAT, incentives and residual value.
How should we interpret the figure of 6.8 billion today?
The figure should be interpreted as an order of magnitude produced by the model. Divided by 5.68 GW, it equates to an average of approximately €1,197/kWp, a figure consistent with a mix of small and large installations but not sufficient to validate the budget. The real question is not just «how much does it cost?», but which portfolios of buildings enable a reduction in transaction costs and an increase in self-consumption and bankability.
Industrial potential
A national pipeline could be structured into homogeneous categories: hospitals, large-scale schools, administrative buildings and small municipalities. This would allow for standard specifications, consolidated procurement, maintenance contracts and project finance. The ultimate economic priority, however, must follow a replicable model.
 Italian
  English
  German
  French
  Spanish
  Polish
  Dutch
Dutch  Romanian
  Hungarian
  Czech
Czech  Swedish
  Portuguese
  Greek
Greek