

A credible national estimate cannot be born from an average surface area multiplied by the number of properties. The Heiwit model uses a geolocated frame, a stratified sample and solar estimates referred to individual elements. Precisely for this reason, the steps that are not yet replicable must be declared.
The chapter in 8 slides
Scroll through the original carousel created for this chapter. The images have been optimised for the web and uploaded to the WordPress Media Library.

On your smartphone swipe sideways. From the keyboard use the left and right arrows.
1. The OpenStreetMap frame
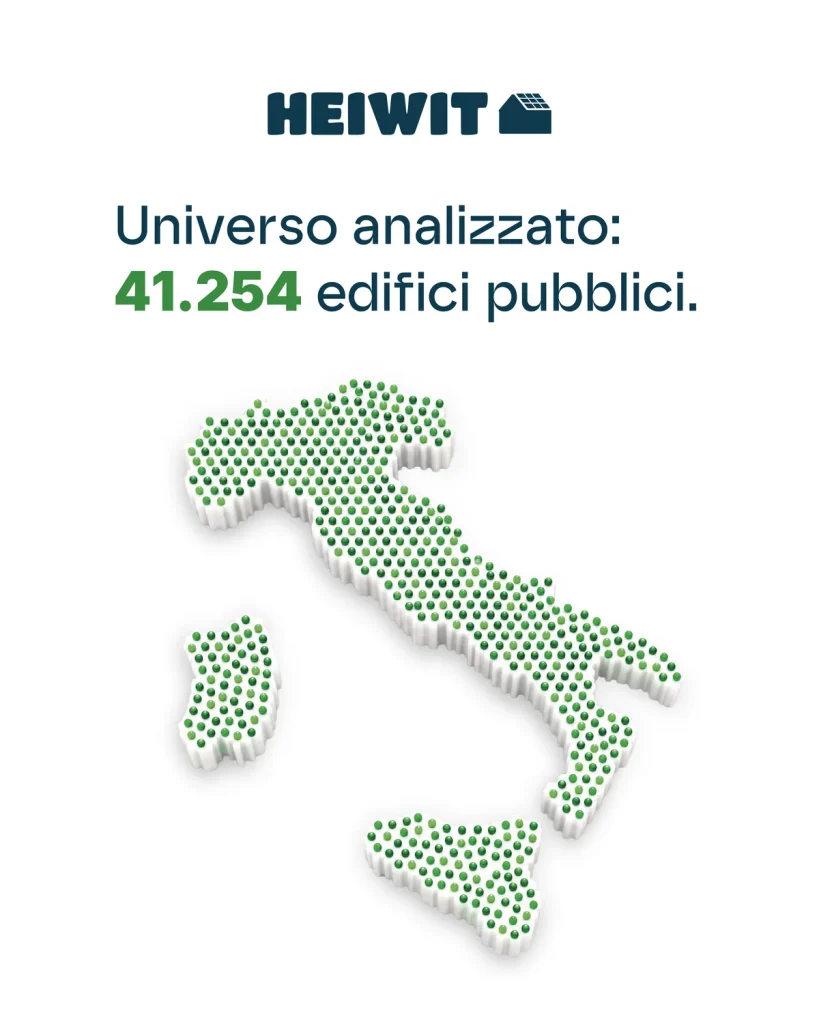
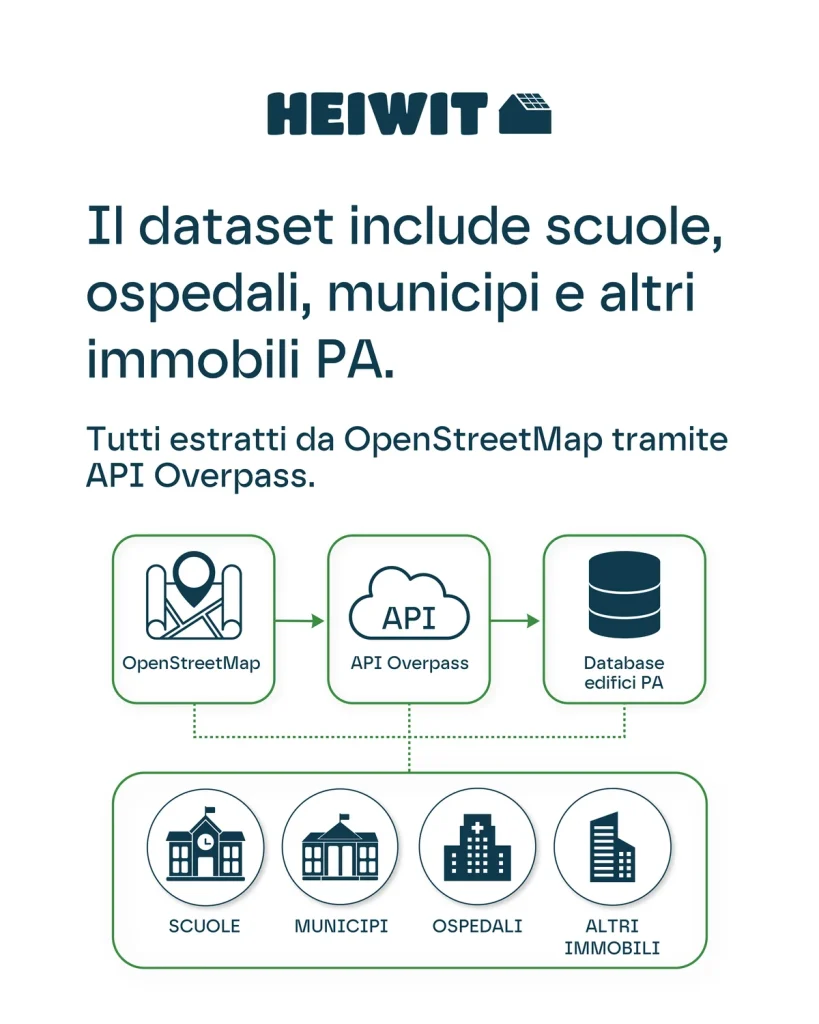
The source universe was extracted from OpenStreetMap via the Overpass API using functional tags attributable to schools, hospitals, town halls and other public services. The correct attribution is: © OpenStreetMap contributors, data available under ODbL 1.0, extraction declared April 2026.
The term «frame» is important. An OSM element does not prove public ownership and can represent a point, a building, a perimeter or a relation. Private schools, clinics and contracted facilities may fall within the functional tags. The Overpass query, deduplication rules and POI-building mapping will therefore need to be published.
2. The stratified sample
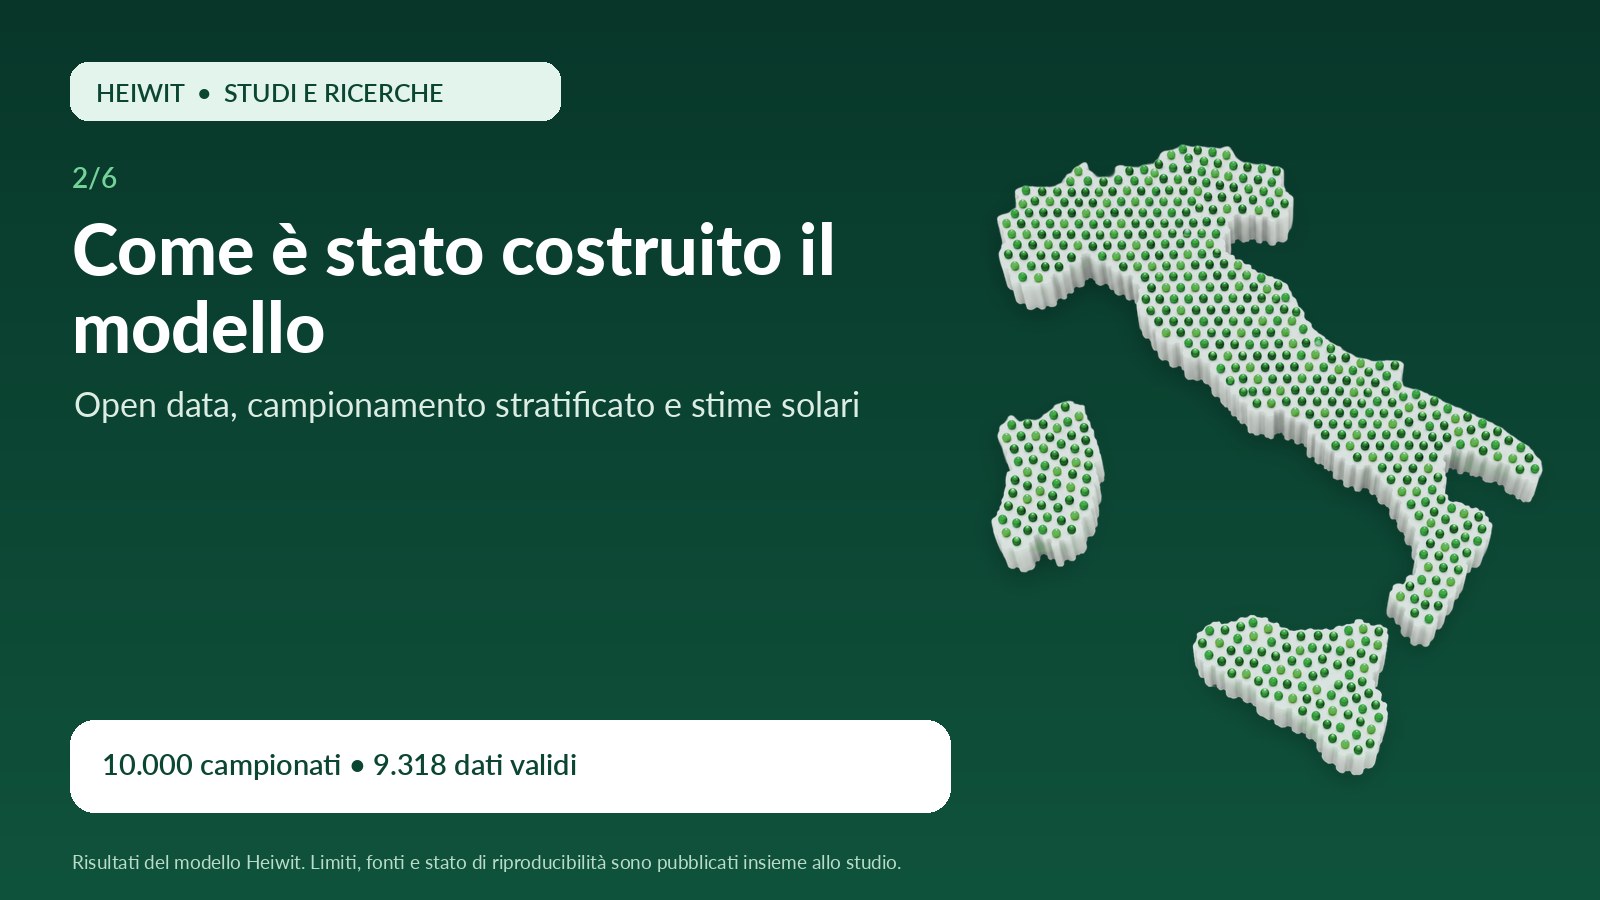
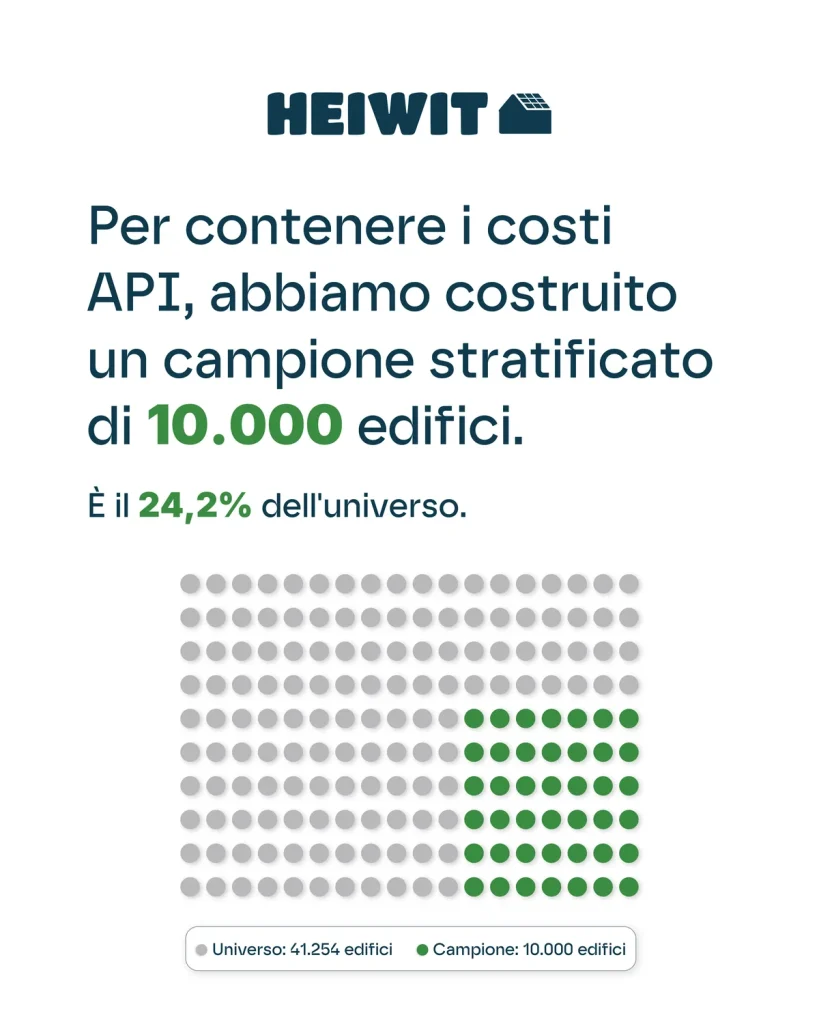
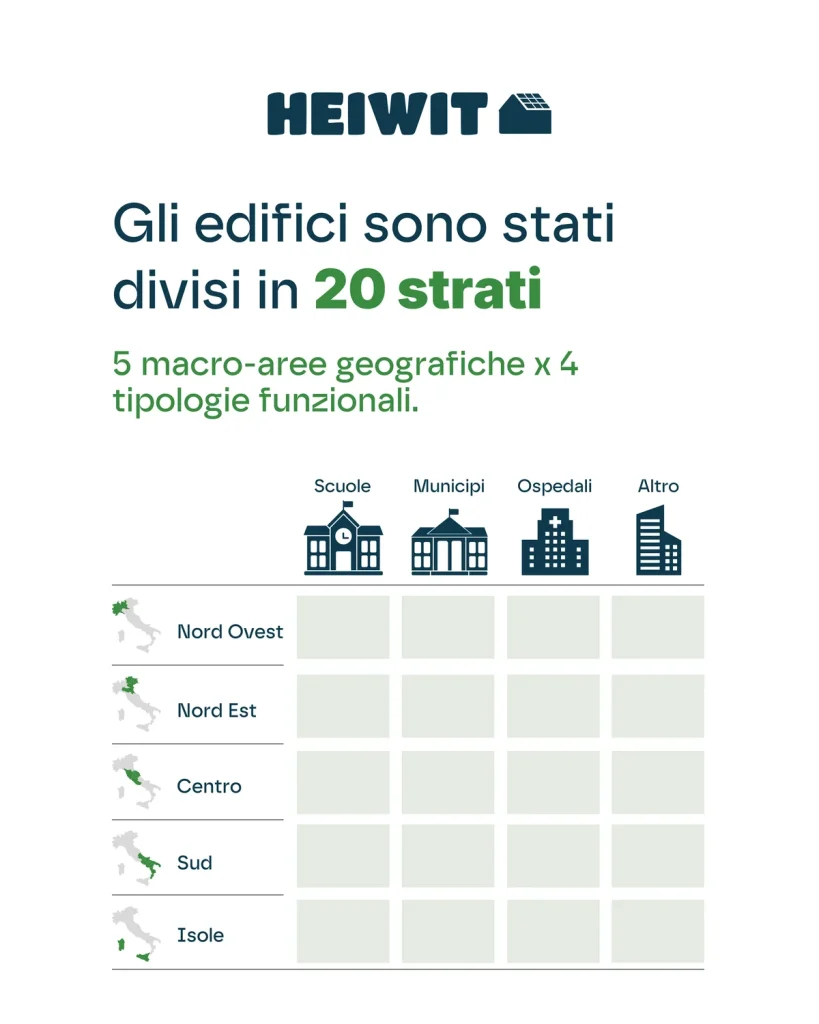
To keep survey costs down, the study specifies a sample size of 10,000 respondents, equivalent to 24.2% of the frame. The sample is divided into 20 strata obtained by cross-referencing five macro-areas and four functional categories. The national total is estimated using the standard stratified estimator, by multiplying the mean of each stratum by the size of that stratum within the population.
However, the materials report 9,318 records with valid data. The 682 missing ones must be classified: API failures, duplicates, items that cannot be associated with a roof, or other exclusions. Without this classification, non-response bias cannot be ruled out.
3. Google Solar API and PVGIS
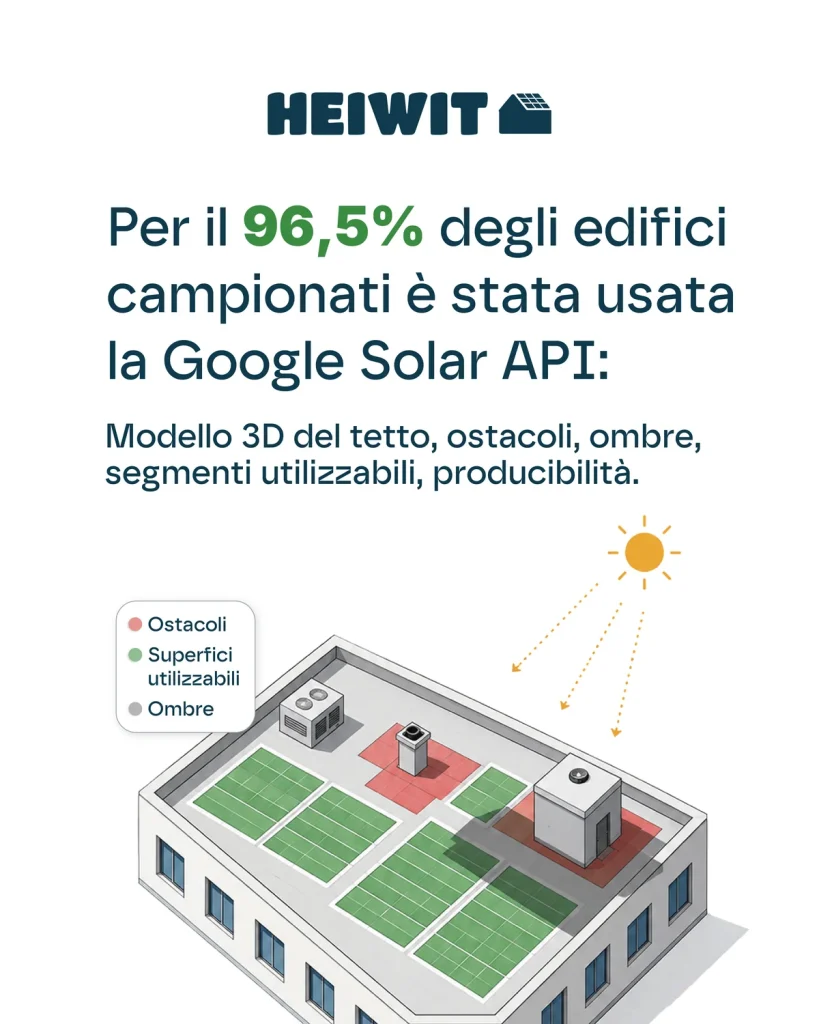
For the sampled elements, the use of the Building Insights endpoint of the Google Solar API has been declared. The attribution to be maintained near the results is: «Source: includes solar data from Google. Aggregate processing by Heiwit S.p.A.; Google is neither the author nor the validator of the study».
The definitive procedure must document the required and returned quality, the date of the imagery, the panel capacity used by the service, the distance between the requested coordinate and the identified building, and checks on multi-building campuses.
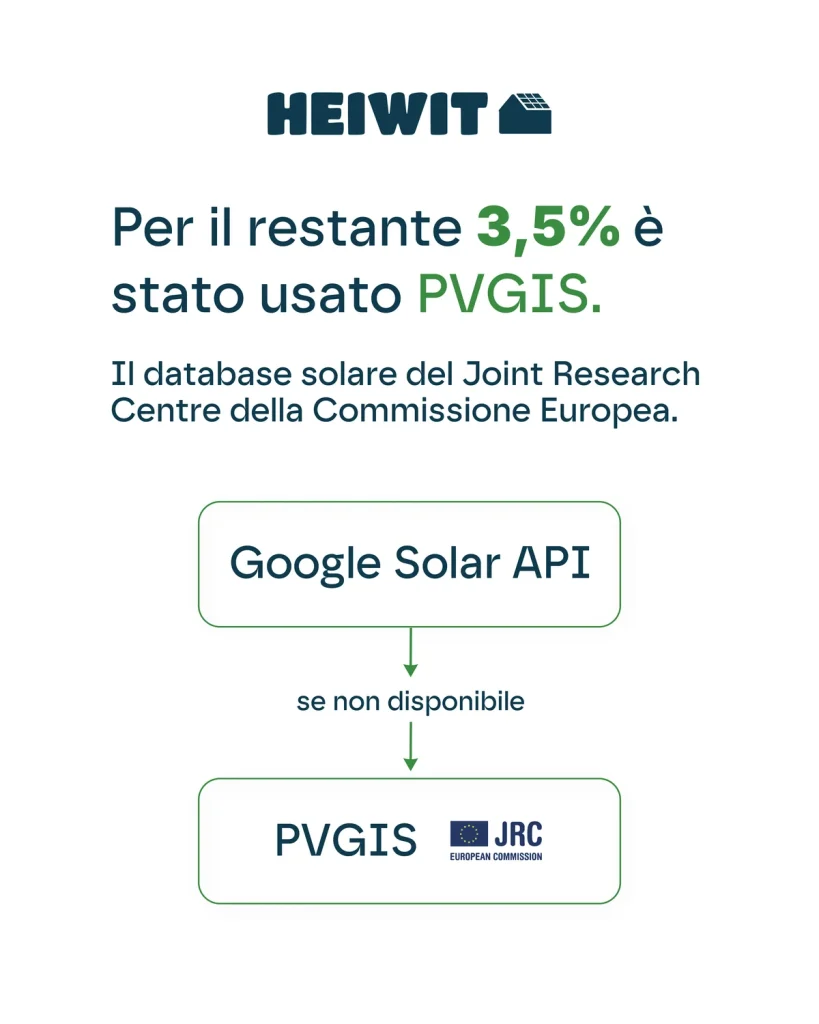
For items processed using PVGIS, the assumptions regarding surface area, roof utilisation factor, orientation and losses must be published. Attribution: PVGIS © European Union / European Commission, Joint Research Centre (JRC), version 5.2; processing by Heiwit S.p.A. The results do not necessarily reflect the position of the European Commission.
4. Bootstrap and confidence intervals
The study states a non-parametric bootstrap of 1,000 iterations. Even if the calculation were correct, the interval would represent sampling uncertainty conditional on the frame and the model. It does not include OSM classification errors, roof matching, image coverage, fallbacks, missing data or economic assumptions.
5. Comparison with GSE Atlaimpianti
A match within 80 metres with Atlaimpianti has been declared. The comparison may be useful, but a distance of less than 80 metres does not prove that the system belongs to the building. What is needed is the distribution of distances, manual checks, false positives and outliers. Furthermore, Atlaimpianti is a large set of systems managed or incentivised by the GSE, not the complete census of Italian photovoltaics.
What is missing for full replication
- Overpass query and deduplication rules;
- 10,000-record dataset and list of 9,318 valid ones;
- Google/PVGIS log and reasons for exclusion;
- sampling, expansion and bootstrap code;
- Atlaimpianti matching file and manual checks;
- regional dataset and economic model.
 Italian
  English
  German
  French
  Spanish
  Polish
  Dutch
Dutch  Romanian
  Hungarian
  Czech
Czech  Swedish
  Portuguese
  Greek
Greek