


Producing a quantity of energy in a year similar to the annual consumption of a perimeter does not mean making it self-sufficient. To transform the potential of public roofs into actually used energy, hourly profiles, the grid, contracts, storage and sharing rules are needed.
The chapter in 8 slides
Scroll through the original carousel created for this chapter. The images have been optimised for the web and uploaded to the WordPress Media Library.

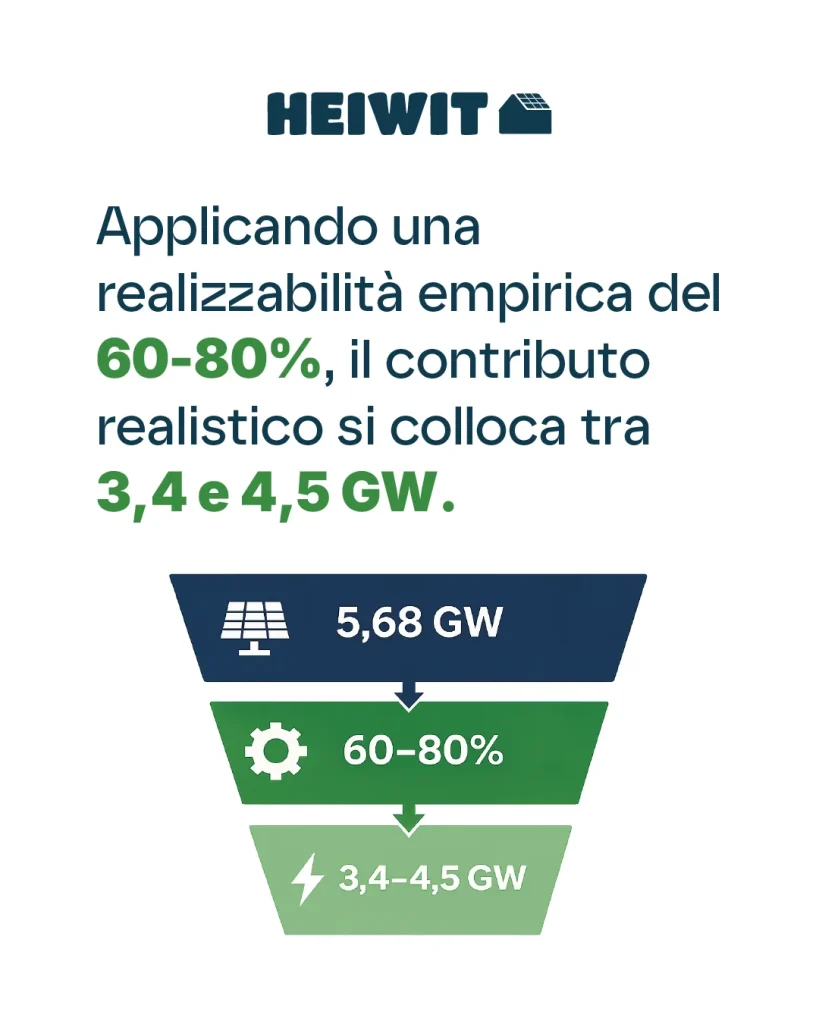
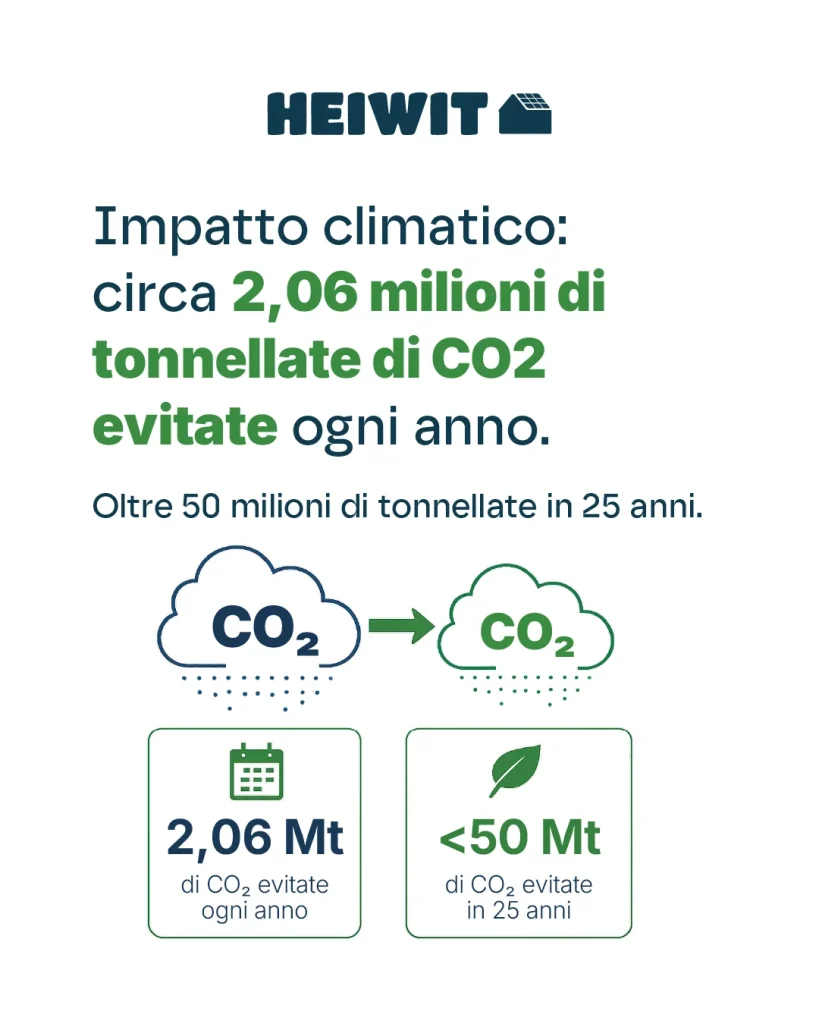
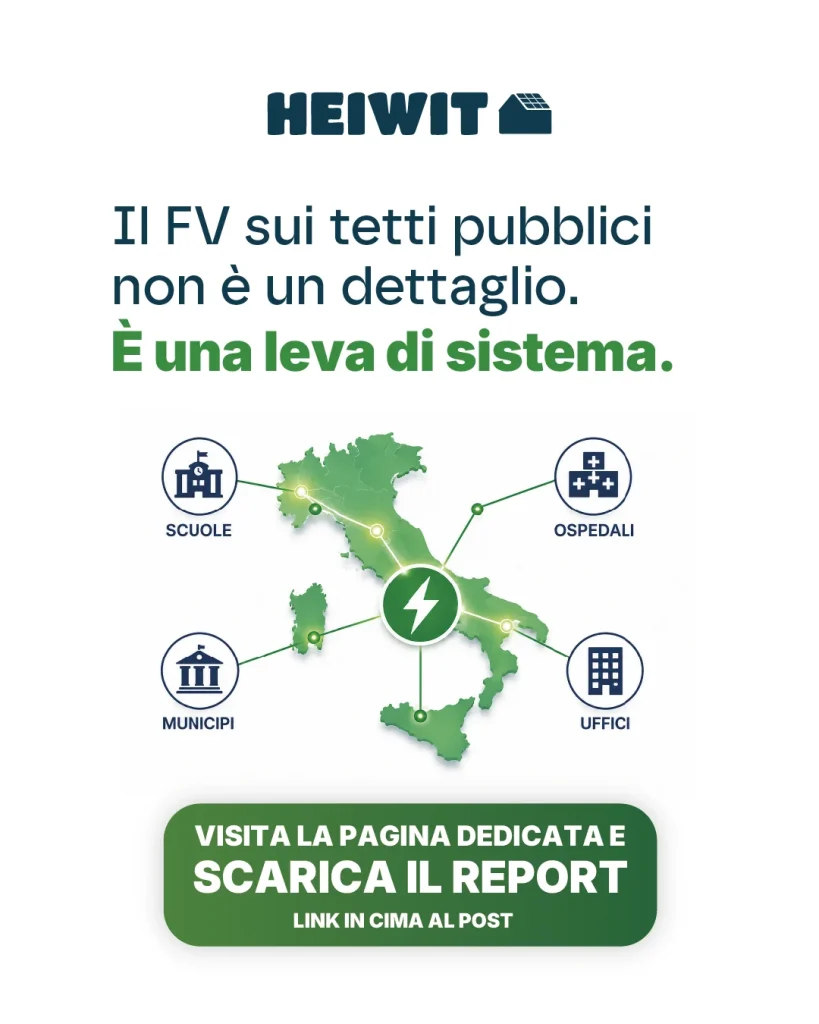
On your smartphone swipe sideways. From the keyboard use the left and right arrows.
Annual balance and self-sufficiency are not synonyms
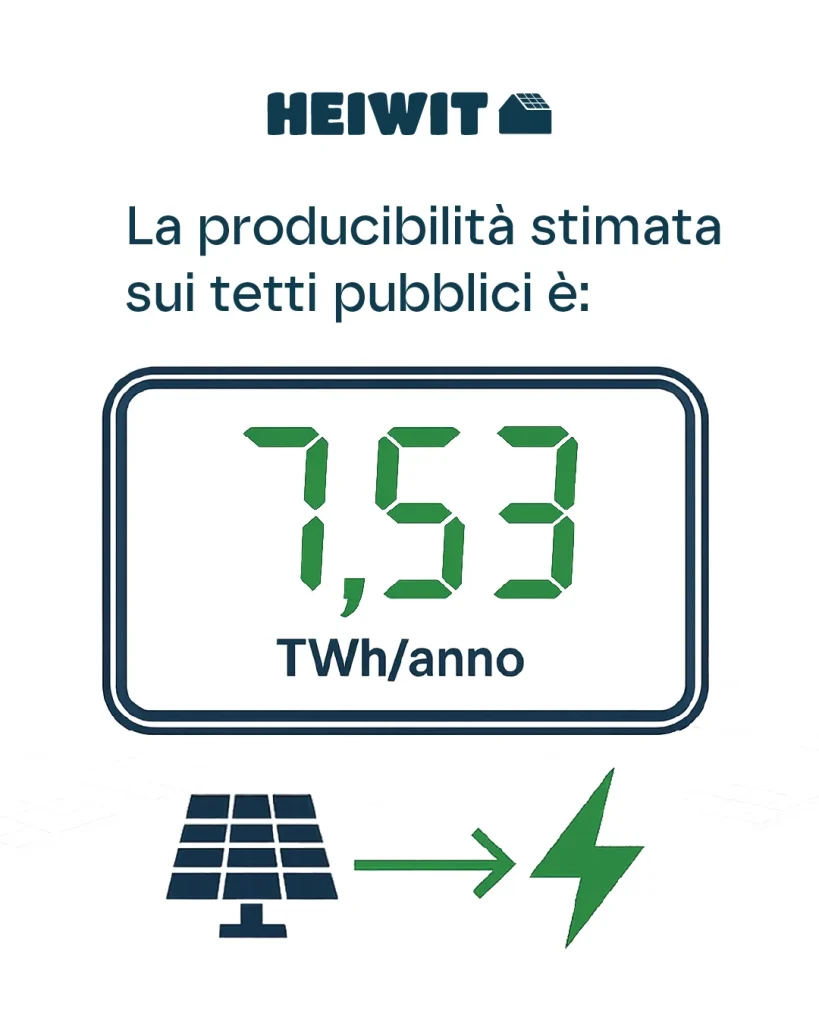
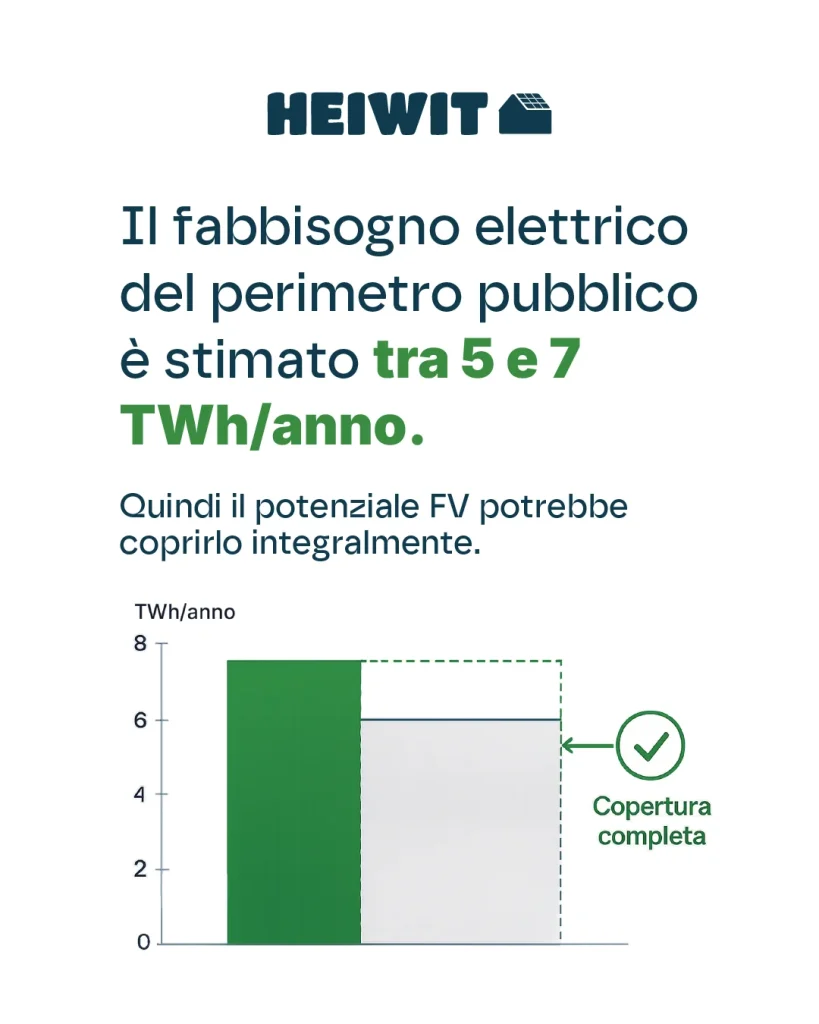
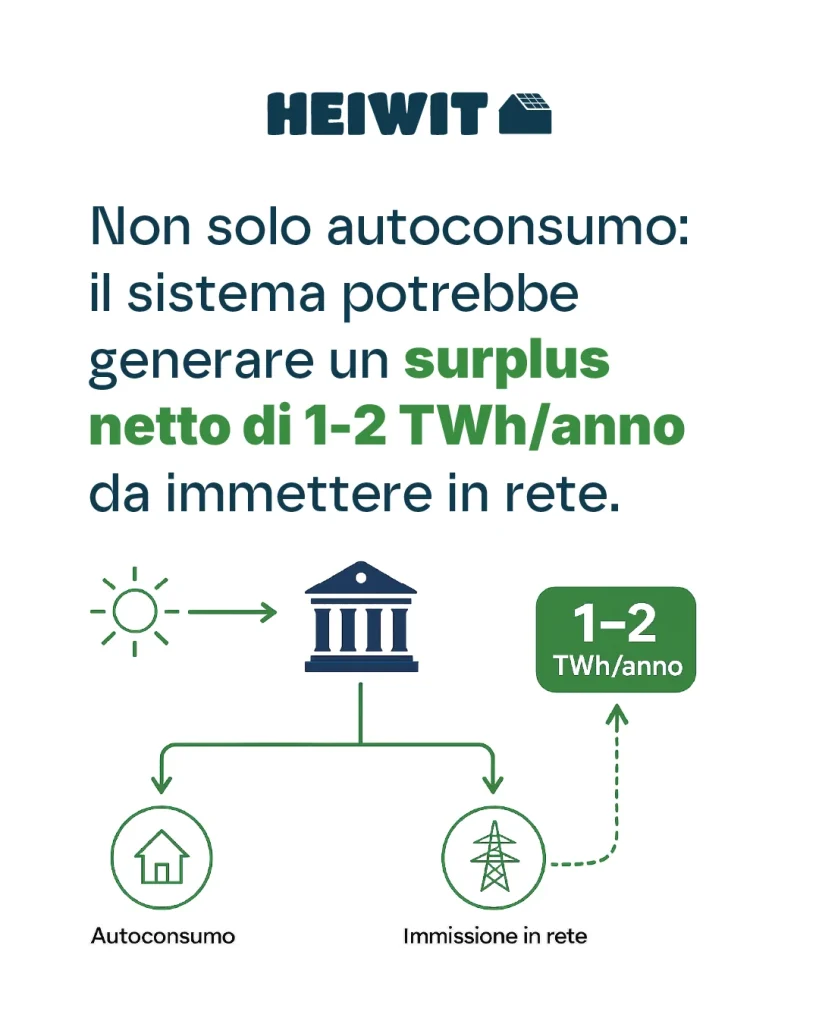
In the original report, the electricity demand of the public administration was indicated in the region of 5–7 TWh, but the specific source still needs to be included. Even provisionally accepting the range, the comparison with 7.53 TWh yields an arithmetic balance between 0.53 and 2.53 TWh. This does not demonstrate self-sufficiency.
Solar PV generates electricity during the day and especially in the sunniest months. Hospitals and offices have significant daytime loads, while schools and town halls can have very different profiles. Excess energy from one building cannot be automatically allocated to another public building without a compatible technical and contractual setup.
The operating variables
- Self-consumption How much of the generation matches the consumption at the same connection point?
- Network Can the substation and the local network accommodate the feed-in?
- Share: energy communities and self-consumption setups can monetise part of the energy, within the limits of the applicable rules.
- Accumulo: It can shift energy over time, but this adds to costs, leads to losses and introduces design criteria.
- Curtailment: a production quota may be unusable or non-marketable.
Avoided emissions: the correction
ISPRA reports an average factor associated with electricity consumption of 192.6 gCO₂/kWh for 2024. Applied to 7.53 TWh, this gives a theoretical maximum for the first year of approximately 1.45 MtCO₂. Applying a feasibility scenario of 60–80%, the order of magnitude becomes 0.87–1.16 MtCO₂ per year.
This is an average, not a marginal, estimate: it does not necessarily describe which power stations would reduce output in any given hour. Furthermore, the grid factor will decrease with decarbonisation; for this reason, a simple constant multiplication for 25 years is not presented.
The role of storage
Energy storage can increase local energy consumption, support evening loads and provide flexibility. However, it should not be installed uniformly across all buildings. A hospital with continuous energy consumption may already have a high level of self-consumption; a school that is closed in August may require energy sharing, load management or a battery sized to match actual consumption patterns.
From theoretical energy to public value
The most useful metric is not just the TWh produced. It is the share of energy self-consumed, shared or fed into the grid with economic value, together with the reduction in the organisation's costs and the resilience of essential services. This part requires consumption data that the study will need to integrate in the next phase.
 Italian
  English
  German
  French
  Spanish
  Polish
  Dutch
Dutch  Romanian
  Hungarian
  Czech
Czech  Swedish
  Portuguese
  Greek
Greek