
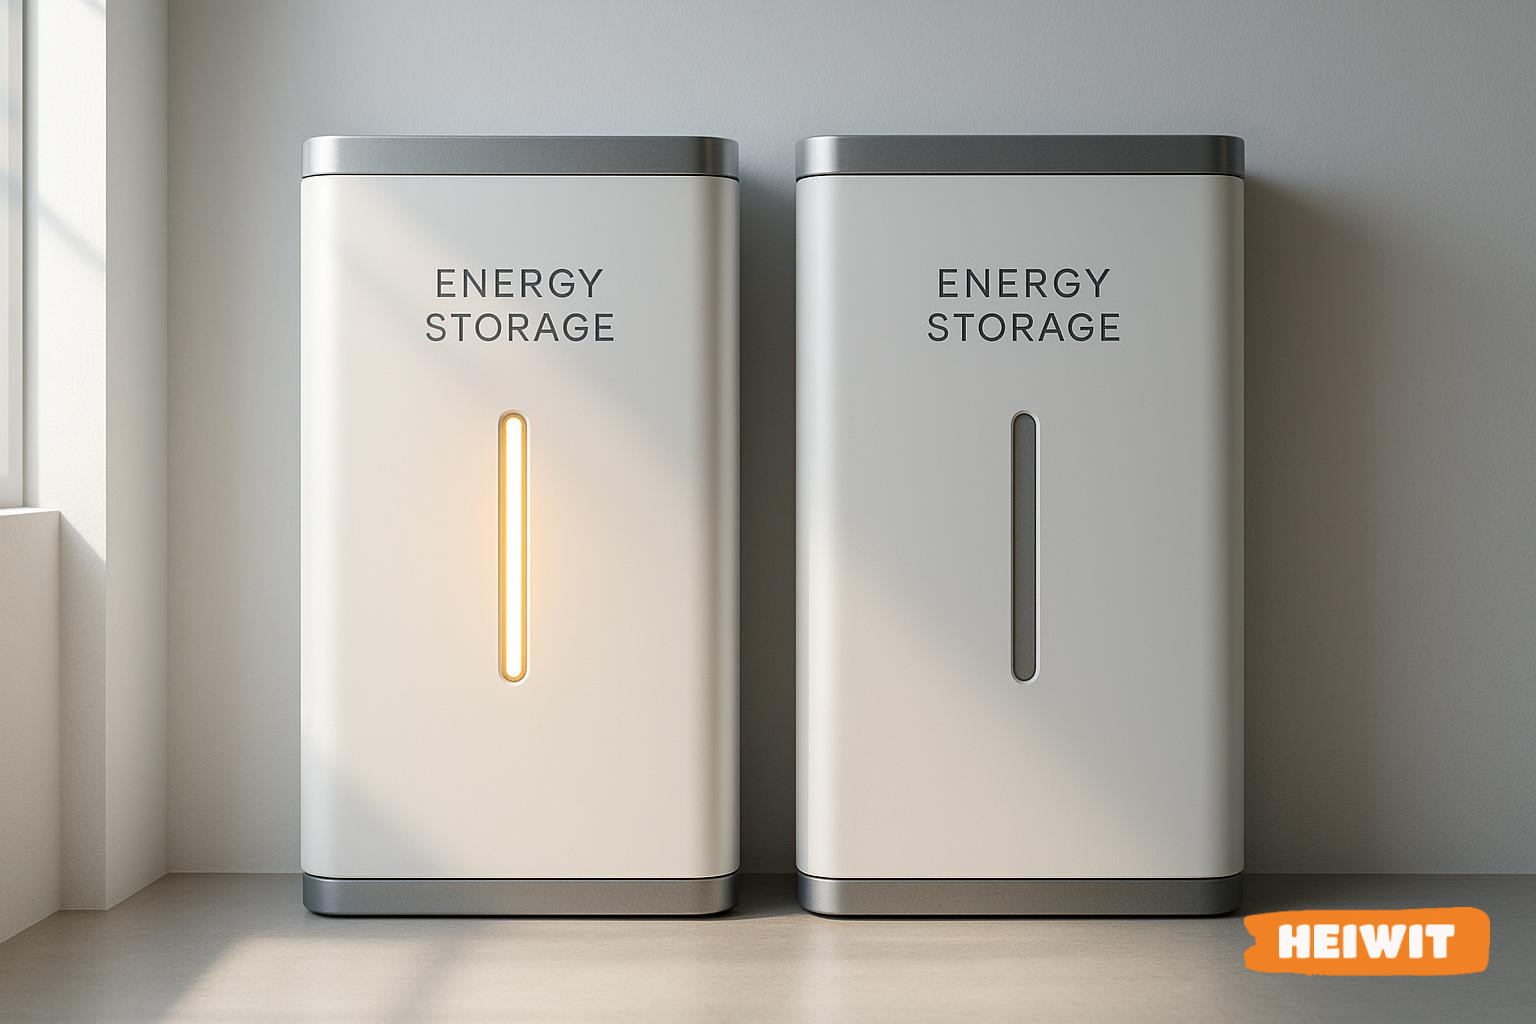
Let's do a quick quiz. You have two batteries in front of you, both 10 kWh, same physical size, similar price. The first claims around 3,000 cycles, the second many thousands. Which one is better value? If you answered “it depends”, you're on the right track. Because the Battery life cycle It is often the real deciding factor between an accumulation that repays the investment and one that disappoints halfway.
In this article, we give you the tools to read a technical data sheet without getting stuck on the most eye-catching number. Because the kWh capacity only tells the beginning of the story.
The myth of kWh: what nominal capacity says (and hides)
La rated capacity It's the energy a battery can store when fully charged, expressed in kWh. It's the most visible figure, and not by chance, the one that ends up in the headlines. But it's an instant snapshot: it tells you how much energy you can conserve at a given moment, not how much you will deliver over its entire lifetime.
It's like judging a car solely by its fuel tank capacity, ignoring how many kilometres it can travel before the engine seizes up. For a designer, stopping at kWh means comparing apples with pears.
The vocabulary you really need
To compare two accumulations honestly, you need a few, but clear, terms:
- Nominal capacityStorable energy at full charge (kWh).
- Depth of discharge (DoD): the percentage of capacity that you can actually use in each cycle. A DoD of 90% means that, out of 10 kWh, you use 9.
- Number of cycleshow many charge and discharge cycles the battery can complete while maintaining acceptable performance.
- End-of-life residual capacity: the threshold marking the “end of service life” (End of Life). This is conventionally set between 70% and 80% of the initial capacity [TO BE CHECKED: EoL convention and cycle counting method in accordance with standards].
- Useful lifethe effective duration of the accumulation, which depends on the available cycles and how many you use each day.
Please note: the number of cycles is almost always referred to a specific DoD and a specific threshold of residual capacity. Changing these parameters also changes the declared cycles. Reading the notes at the bottom of the datasheet, here, makes the difference.
The formula that shifts focus to the cyclical life of batteries
There's a simple operation that clarifies everything. The energy actually delivered over the entire lifespan of a battery is estimated as follows:
Total energy delivered = Nominal capacity × DoD × Number of cycles
This formula is the heart of the reasoning. Capability is just one of three factors. If you multiply by a low DoD or by few cycles, the result collapses. This is where two “twin” batteries on paper go their separate ways.
Numerical example: same kWh, different value
Let’s get back to the quiz. Let’s take two 10 kWh batteries, both with a DoD of 90%, in a domestic or commercial setting with 1-2 charge cycles Daytime (photovoltaic charging during the day, consumption discharging in the evening).
- Battery A — 3,000 cycles: 10 kWh × 0.90 × 3,000 = 27,000 kWh provided in life.
- Battery B — 10,000 cycles: 10 kWh × 0.90 × 10,000 = 90,000 kWh provided in life.
At the same apparent capacity and price, battery B.
We specify that the 10,000 cycles The figures cited represent a technological milestone towards which the storage sector is moving, not a characteristic of a specific product. They serve only to clarify the reasoning. The numerical examples must always be validated with the actual datasheet information [TO BE VERIFIED: numerical examples to be validated].
Cost per cycle and TCO: the count that counts
Now let's translate everything into money. The most honest indicator is not the purchase price, but the cost per kWh supplied throughout their entire life. Simply divide the battery's price by the total energy delivered.
If battery A and battery B cost the same, battery B has a cost per cycle — and per kWh delivered — three times lower. It's the concept of TCO accumulation (Total Cost of Ownership): not.
For designers and installers, this is also a selling point: shifting the conversation with the client from list price to lifetime value. Those who delve into the cost logic of accumulation find useful analyses in industry literature too, such as guides on LCOS and BESS systems market trends.
When cyclical life becomes the dominant parameter
Not all scenarios weigh cycles the same. But in one case their weight becomes decisive: the applications with frequent cycling.
- Aggressive self-consumption with one or two full cycles a day.
- Price arbitrageCharge when energy is cheap, discharge when it's expensive.
- Integration with heat pumps or vehicle charging, where the battery works a lot.
In these contexts, a battery with more cycles simply works harder and for longer. Instantaneous capacity takes a back seat; what matters is the total energy you can get through before it reaches the end of its life. This is the message to bear in mind: The energy provided over a lifetime counts more than the instantaneous capacity, and cycles are the true indicator of value..
The question that remains open
At this point, it's natural to ask: what chemically determines how many cycles a battery can perform? Why does one chemistry “last” for thousands of cycles while another degrades quickly? This is a topic deserving of a dedicated article, and we'll tackle it soon.
For now, remember the golden rule: when comparing two batteries, don't stop at kWh. Always ask yourself about DoD, stated cycles, and residual capacity at end-of-life. Then do the multiplication.
Would you like a practical tool? Download our checklist for comparing storage systems: a few points to tick off so you aren't fooled by just the headline figure.
 Italian
  English
  German
  French
  Spanish
  Polish
  Dutch
Dutch  Romanian
  Hungarian
  Czech
Czech  Swedish
  Portuguese
  Greek
Greek